What To Expect From Chevron’s Q2 Earnings Report?

Chevron Corporation (NYSE: CVX) reports Q2 results on Friday, August 1, with analysts expecting EPS of $2.15 on $48.39 billion in revenue. That’s a 29% drop in earnings and a 9% dip in sales year over year. Historically, the stock has fallen after earnings 50% of the time, with a median one-day decline of 3.5%, and a worst-case plunge of 7%.
While the company has signaled that demand may soften due to U.S. tariffs and OPEC’s accelerated production, it remains committed to its current capital spending strategy. The company has $320 Bil in current market capitalization. Revenue over the last twelve months was $193 Bil, and it was operationally profitable with $17 Bil in operating profits and net income of $16 Bil. While a lot will depend on how results stack up against consensus and expectations, understanding historical patterns might just turn the odds in your favor if you are an event-driven trader.
For event-driven traders, historical patterns may offer an edge, whether by positioning ahead of earnings or reacting to post-release moves. That said, if you seek upside with lower volatility than individual stocks, the Trefis High Quality portfolio presents an alternative, having outperformed the S&P 500 and generated returns exceeding 91% since its inception. See earnings reaction history of all stocks.
- Chevron Earnings: Upstream Strength Overcomes Downstream Accounting Headwinds
- Should You Pay Attention To Chevron Stock’s Momentum?
- Why Chevron Stock May Drop Soon
- Does Chevron Stock Still Have Room to Run?
- Should You Pay Attention To Chevron Stock’s Momentum?
- Chevron Stock Hands $123 Bil Back – Worth a Look?
 Image by AdmiralFox from Pixabay
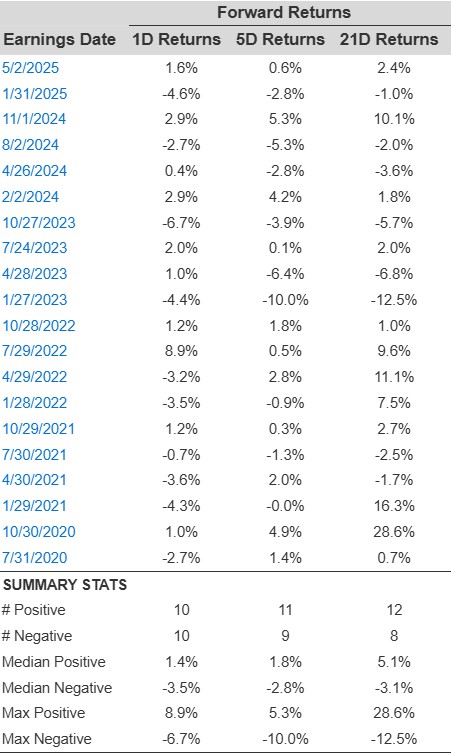
Chevron’s Historical Odds Of Positive Post-Earnings Return
Some observations on one-day (1D) post-earnings returns:
- There are 20 earnings data points recorded over the last five years, with 10 positive and 10 negative one-day (1D) returns observed. In summary, positive 1D returns were seen about 50% of the time.
- Notably, this percentage increases to 64% if we consider data for the last 3 years instead of 5.
- Median of the 10 positive returns = 1.4%, and median of the 10 negative returns = -3.5%
Additional data for observed 5-Day (5D), and 21-Day (21D) returns post earnings are summarized along with the statistics in the table below.
Correlation Between 1D, 5D, and 21D Historical Returns
A relatively less risky strategy (though not useful if the correlation is low) is to understand the correlation between short-term and medium-term returns post earnings, find a pair that has the highest correlation, and execute the appropriate trade. For example, if 1D and 5D show the highest correlation, a trader can position themselves “long” for the next 5 days if 1D post-earnings return is positive. Here is some correlation data based on 5-year and 3-year (more recent) history. Note that the correlation 1D_5D refers to the correlation between 1D post-earnings returns and subsequent 5D returns.
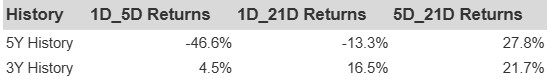
CVX Correlation Between 1D, 5D and 21D Historical Returns
Learn more about Trefis RV strategy that has outperformed its all-cap stocks benchmark (combination of all 3, the S&P 500, S&P mid-cap, and Russell 2000), to produce strong returns for investors.
Invest with Trefis Market-Beating Portfolios