Where Will Oil Prices Be On March 31?

A week ago, WTI posted its largest weekly gain in futures history, dating back to 1983. Brent surged a massive ~30% in early Asian trade last Monday (Mar 9), briefly touching $119.50 before giving up gains. As of March 16, Brent is trading near $104-$105, the first sustained close above $100 since August 2022. The question every investor is asking right now: is this the top, or does it get worse? Where will the price be a month from now?
The answer depends on four variables: the Strait of Hormuz, Qatari LNG, a 33-week speculative crowding in WTI, and a sanctions waiver expiring April 11. Get those four right, and the March 31 settlement becomes tractable.
How Bad Is The Physical Disruption At Hormuz?
On February 28, US-Israeli strikes on Iran killed its Supreme Leader Khamenei. Two days later, on March 2, Iran’s IRGC formally closed the Strait of Hormuz with tanker traffic is now down ~90%. Since then, Iran’s succession is resolved. Mojtaba Khamenei, son of the killed ayatollah, was appointed supreme leader. From his statements, it is clear that he believes that the Strait of Hormuz must remain closed as an economic tool to pressure the U.S.
- Chevron Earnings: Upstream Strength Overcomes Downstream Accounting Headwinds
- Should You Pay Attention To Chevron Stock’s Momentum?
- Why Chevron Stock May Drop Soon
- Does Chevron Stock Still Have Room to Run?
- Should You Pay Attention To Chevron Stock’s Momentum?
- Chevron Stock Hands $123 Bil Back – Worth a Look?
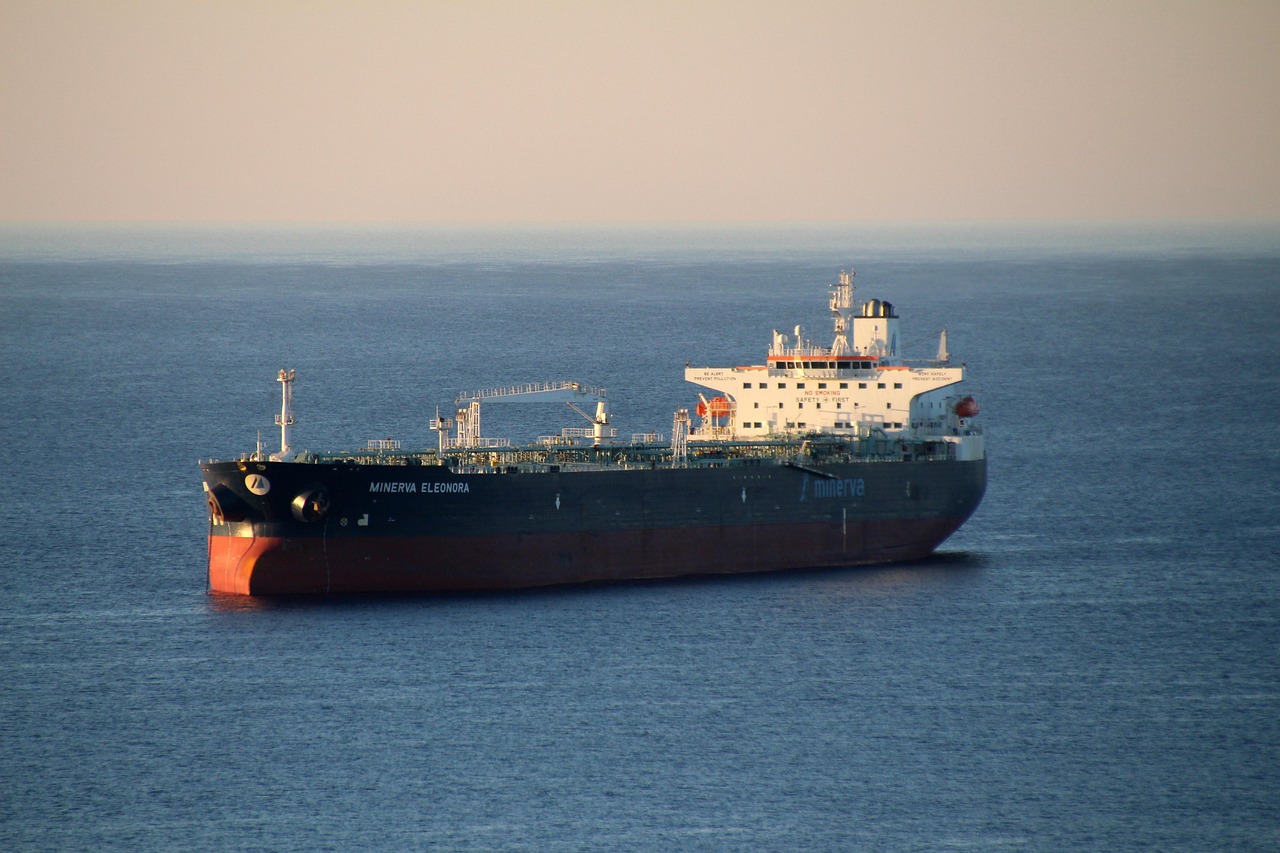
The real signal is in freight and insurance. VLCC (very large crude carrier) rates on the Middle East Gulf – China route have spiked and sustained above $450,000/day – an all-time record. For context, in normal markets these rates sit in the low-to-mid five digits (~$50K or lower). More critically, the major P&I Clubs such as Gard, Skuld, NorthStandard, and London P&I have cancelled war risk cover for Persian Gulf transits. No insurance means no transit, regardless of naval escort.
In addition, Iraq has cut ~3.0 mb/d, southern fields are down ~70%, from 4.3 mb/d to ~1.3 mb/d . This was not a strategic move but rather an operational one. The storage is full with nowhere to send the barrels. Kuwait faces similar pressure. Gulf countries could exhaust storage capacity entirely, forcing production shutdowns and potentially spiking Brent to $120/bbl. These aren’t decisions that reverse the moment the Strait reopens; restarting capped wells takes weeks, creating an asymmetric supply tail even in a resolution scenario.
What Is The Role Of Qatari LNG?
On March 2, Iranian drones struck QatarEnergy’s facilities and the country immediately halted all LNG production. Qatar supplies just under 20% of global LNG. The market reaction was instant: European gas futures surged up to 54%, UK gas +50%, Dutch TTF +45%, Asian LNG spot prices +39%, LNG tanker rates +40% on the same day.
QatarEnergy’s CEO Al-Kaabi has stated that a restart could take “weeks or months” even after hostilities end, and that production will not resume until the conflict fully concludes. He separately warned crude could hit $150/bbl if Hormuz remains closed. Europe’s post-Ukraine pivot to Qatari LNG as a Russian substitute has been undone overnight. This feeds directly into inflation prints, sovereign credit spreads, and industrial margin compression – particularly in China, where surging LNG prices will drive up power costs for energy-intensive manufacturers already under tariff pressure.
The U.S. Plan Of Releasing SPR May Not Be Enough
The Trump administration has now committed to the largest emergency reserve release in history. On March 11, the IEA’s 32 member nations unanimously agreed to release 400 million barrels from strategic reserves. The U.S. is leading the effort with 172 million barrels from the SPR – 41% of the total IEA action. The US will release those barrels over 120 days, implying ~1.4 mb/d of additional supply, which covers only a small fraction of Hormuz supply loss. The SPR still holds ~415 million barrels, meaning the US drawdown represents 41% of the reserve. Markets shrugged: Brent climbed back above $100 the same day the announcement was made. The only durable fix is getting oil flowing through the Strait.
There is a pre-war surplus, and this is what pulls prices back down once the Strait reopens. Non-OPEC+ production was firmly outpacing sluggish demand growth going into the conflict, and the IEA expected global supply to far exceed demand through 2026. But that buffer is being consumed faster than consensus models assume. In the 15 days before Operation Epic Fury, Iran tripled its oil export rate and drew down storage to minimize vulnerability. Saudi Arabia ran similar pre-positioning. The inventory cushion is therefore smaller than models built on normal pre-crisis stock levels would suggest – which matters significantly when estimating how quickly the surplus reasserts after any resolution. The scale of the problem is illustrated by OPEC+’s March 1 decision to add 206,000 b/d in April: a planned increase that is now largely irrelevant against the 3+ million barrels per day of production that has been involuntarily forced offline across Iraq, Kuwait, and the Gulf – simply because storage is full and tankers cannot move.
So What Could Happen Next?
(a) One Of The Dates That Matters is April 11.
On March 5, Treasury Secretary Bessent issued a 30-day OFAC license allowing Indian refiners to receive Russian crude already stranded at sea (worth ~$3B) of floating inventory that had accumulated as Indian demand for Russian crude collapsed since August 2025. However, the U.S. subsequently expanded the scope and announced a broader 30-day waiver allowing all countries to purchase Russian crude already loaded on vessels before March 12.
This waiver expires on April 11 and if renewed, Washington is prioritizing consumer prices over sanctions enforcement and oil softens. If not renewed, India and other countries scramble for Atlantic Basin barrels, and any rebound from Hormuz reopening could be shallower than the futures curve implies.
(b) Fear Trade Unwinds
CFTC Commitment of Traders report showed managed money net-long WTI is at a 33-week high a week ago. The net long position since then has continued to climb. These longs are now deeply in the money and fragile. The September 2019 Abqaiq attack is the cleanest precedent: 5.7 mb/d removed overnight – the largest single supply shock in history. Brent spiked 15% in one session and had fully retraced within two weeks. The 1990 Gulf War analog reinforces this: Iraq’s invasion doubled oil from $17 to $41 in three months on fear alone. When Desert Storm began and Saudi infrastructure proved safe, oil crashed $10 in a single session. The reversal could be as fast as the spike.
(c) Demand Correction
At sustained $110+ Brent, demand destruction kicks in within 4 to 6 weeks through jet fuel crack spreads, freight costs, and end-consumer price transmission. Two economies matter most – China and India.
China’s EV penetration has structurally capped gasoline demand growth, making it less of a positive demand surprise than in 2021-2022. The real China risk is on the LNG side – surging industrial power costs compressing margins for energy-intensive manufacturers already under tariff pressure. India is the most acute pressure point. Hormuz dependency exceeds 50% of crude imports. At $110+, the current account deficit balloons rapidly, and rupee weakness then amplifies the local-currency cost of imports beyond the headline price – a feedback loop that could force demand destruction faster than models assume.
Realistic Scenarios On March 31
Slight Reversal ($88-100 Brent): The United States’ new insurance proposal and navy escorts (potentially including UK and other countries), combined with degraded IRGC capability, allow gradual traffic resumption. Other insurers begin re-entering directionally. Involuntary shut-ins arrest at ~3 mb/d. Spec longs unwind violently. The pre-war structural surplus reasserts as the gravitational pull on prices.
Grinding Closure ($108-125 Brent): Strait remains effectively closed through March. Storage exhaustion forces 4+ mb/d of involuntary shut-ins. Qatar LNG stays offline. April 11 waiver expiry becomes the next flashpoint. Demand destruction begins visibly compressing global PMIs by late April.
Infrastructure Escalation ($130-150+ Brent): Successful strike on Saudi Aramco processing infrastructure. Demand destruction becomes the only governor. The Fed faces a 1970s-style stagflation bind. Al-Kaabi’s $150 target becomes base case, not tail.
So What Can You Do For Your Investments?
While the headline panic over crude prices and collapse in Hormuz tanker traffic is deafening, the true tail risks of demand destruction and a 1970s-style stagflation bind are what actually threaten your long-term capital. Letting fear dictate your trades leaves your portfolio highly exposed. This is where objective and rule-based investing and multi-asset exposure come into the picture. Our wealth management partner builds rule-based robust portfolios to capture and protect wealth while leveraging the Trefis High Quality Portfolio, which has returned > 105% since inception.