Up 20% In 3 Weeks, Is Salesforce Stock Still Attractive?

After an almost 20% rise in Salesforce.com’s (NYSE: CRM) stock from $134 on 1st April 2020 to $163 at the end of 20th April 2020, we believe that Salesforce’s stock has limited upside potential as it is already in line with the price at the beginning of this year. One of the primary reasons Salesforce’s stock has recovered is that more than 90% of its revenue is deferred – hence the coronavirus lockdown is not expected to make a significant impact on its top line. However, we believe that after the coronavirus crisis, CRM’s stock is likely to underperform its peers like IBM as well as the broader market. Our dashboard What Factors Drove 18.8% Change In Salesforce Stock Between FY 2018 And Now? provides the key numbers behind our thinking and we explain more below.
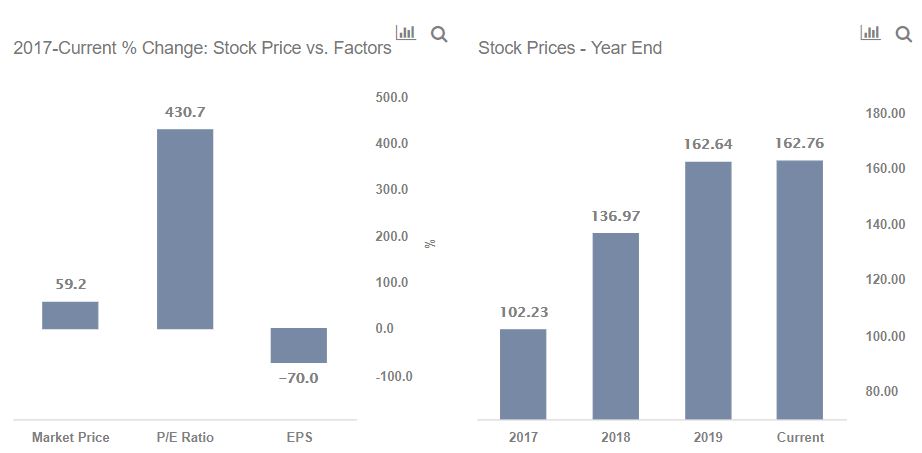
The stock price rise from $102 at the end of Dec 2017 to $162 at the end of Dec 2019 is justified by the roughly 62.2% increase in Salesforce’s revenues from FY 2018 to 2020. This was offset by a fall in net income margin from 3.4% in FY 2018 to 0.7% in FY 2020 primarily due to one-time foreign incremental tax costs. As a result, the net income figure fell from $0.4 billion in FY 2018 to $0.1 billion in FY 2020. Taken together with the ~16% increase in share count, this translated into a 70% decline in EPS over the period. (Note: Salesforce.com reports on a fiscal year ending Jan 31)
- Down 7.3% In A Day, Where Is Salesforce Stock Headed?
- Up 69% In The Last Twelve Months, What To Expect From Salesforce Stock?
- Up 74% Since The Beginning of 2023, Will Salesforce Stock Continue Its Strong Rally?
- Salesforce Stock Is Undervalued
- Salesforce Stock To Edge Past The Consensus In Q1
- Salesforce Stock Is Trading Below Its Fair Value
The fall in EPS was offset by a rise in CRM’s P/E multiple, which rose from 204.5x at the end of Dec 2017 to 1084.3x at the end of Dec 2019. This reflects over a 430% rise from Dec 2017 (FY2018) until Dec 2019 (FY 2020). The multiple has increased to 1085.5x currently which reflects a 430.7% decrease from Dec 2017 to April 2020. That said, the rise in P/E multiple between 2018 and 2019 was not due to a change in the company’s fundamentals, as even though the EPS fell in FY 2020 the market seemed to expect higher growth from the company and set aside the one-time cost impact on the bottom line.
Effect of Coronavirus
The global spread of coronavirus has led to lockdown in various cities across the globe, which has affected industrial and economic activity. This is likely to adversely affect consumption and consumer spending. CRM’s stock is down by about 11% since January 31 after the World Health Organization (WHO) declared a global health emergency in light of the spread of coronavirus. However, during the same period, the S&P 500 index saw a decline of about 12.5%. Moreover, about 70% of CRM’s total revenue comes from the US region which has been the worst impacted by the outbreak. Lower consumer spending and consumption might lead to lower demand for customer relationship products as companies would focus solely on core expenditures – affecting CRM’s revenues.
We believe Salesforce’s Q1 results in late May will confirm the trend in revenues. It is also likely to accompany a lower Q2 as well as FY’21 guidance. If there isn’t clear evidence of the containment of the virus at the time of the earnings announcement, we believe there is a possibility that CRM’s stock could see a further downside. However, if there are signs of abatement of the crisis by the time Q2 results are announced in late August, the company’s stock could see an upturn. With a 11% decline in its stock price since January 31, 2020, CRM has out-performed IBM (-16%) and the S&P 500 (-12.5%). For now, we believe Salesforce’s stock is likely to remain around its current levels, with a limited upside post coronavirus.
View our dashboard analysis Coronavirus Trends Across Countries, And What It Means For The U.S. for the current rate of coronavirus spread in the U.S. and forecasts on where it could be headed, based on comparison with other countries. Our dashboard -28% Coronavirus crash vs. 4 Historic crashes builds a more complete macro picture of historic crashes and how the sell-off during early March compares with them. The complete set of coronavirus impact and timing analyses is available here.
See all Trefis Price Estimates and Download Trefis Data here
What’s behind Trefis? See How It’s Powering New Collaboration and What-Ifs For CFOs and Finance Teams | Product, R&D, and Marketing Teams