How Will Comcast Stock React To Its Upcoming Earnings?

Comcast (NASDAQ:CMCSA) is set to report its earnings on Thursday, July 31, 2025. In the previous quarter, Comcast reported a net loss of 199,000 broadband subscribers – its worst quarterly decline on record – due to mounting pressure from telecom rivals like T-Mobile, which are aggressively expanding their fixed wireless broadband offerings. So are these challenges likely to persist into Q2 as well? It sure looks like it. T-Mobile, once primarily known for mobile services, has emerged as a serious broadband competitor via its Fixed Wireless Access (FWA) product, targeting suburban and rural markets underserved by cable. In Q2, it reported a 12% year-over-year increase in 5G broadband net additions to 454,000. At the same time, Charter Communications, a major cable provider, lost 117,000 broadband subscribers in Q2, falling short of analyst expectations. This suggests that Comcast is also likely to face continued headwinds. Overall, per consensus estimates, earnings for the quarter are expected to come in at about $1.18 per share, down by about 3% year-over-year, while revenues are expected to stay roughly flat at $29.8 billion.
The company has $127 Bil in current market capitalization. Revenue over the last twelve months was $124 Bil, and it was operationally profitable with $23 Bil in operating profits and net income of $16 Bil. While a lot will depend on how results stack up against consensus and expectations, understanding historical patterns might just turn the odds in your favor if you are an event-driven trader.
There are two ways to do that: understand the historical odds and position yourself prior to the earnings release, or look at the correlation between immediate and medium-term returns post earnings and position yourself accordingly after the earnings are released. That said, if you seek upside with lower volatility than individual stocks, the Trefis High Quality portfolio presents an alternative – having outperformed the S&P 500 and generated returns exceeding 91% since its inception.
See earnings reaction history of all stocks
Comcast’s Historical Odds Of Positive Post-Earnings Return
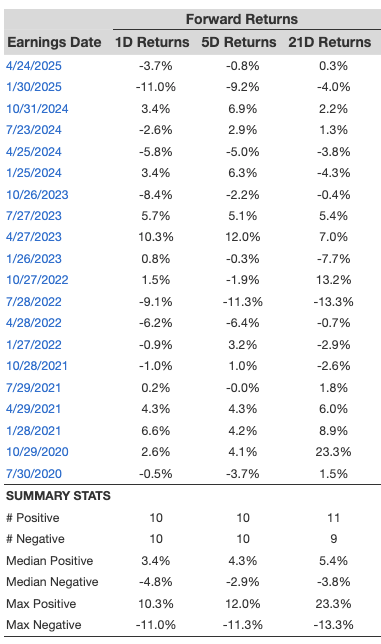
Some observations on one-day (1D) post-earnings returns:
- There are 20 earnings data points recorded over the last five years, with 10 positive and 10 negative one-day (1D) returns observed. In summary, positive 1D returns were seen about 50% of the time.
- Notably, this percentage increases to 55% if we consider data for the last 3 years instead of 5.
- Median of the 10 positive returns = 3.4%, and median of the 10 negative returns = -4.8%
Additional data for observed 5-Day (5D), and 21-Day (21D) returns post earnings are summarized along with the statistics in the table below.
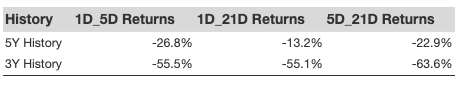
Correlation Between 1D, 5D and 21D Historical Returns
A relatively less risky strategy (though not useful if the correlation is low) is to understand the correlation between short-term and medium-term returns post earnings, find a pair that has the highest correlation, and execute the appropriate trade. For example, if 1D and 5D show the highest correlation, a trader can position themselves “long” for the next 5 days if 1D post-earnings return is positive. Here is some correlation data based on 5-year and 3-year (more recent) history. Note that the correlation 1D_5D refers to the correlation between 1D post-earnings returns and subsequent 5D returns.
Learn more about Trefis RV strategy that has outperformed its all-cap stocks benchmark (combination of all 3, the S&P 500, S&P mid-cap, and Russell 2000), to produce strong returns for investors. Separately, if you want upside with a smoother ride than an individual stock like Comcast, consider the High Quality portfolio, which has outperformed the S&P, and clocked >91% returns since inception.
Invest with Trefis Market-Beating Portfolios
See all Trefis Price Estimates