What To Expect From Comcast’s Q3 Earnings?

Comcast (NASDAQ:CMCSA) is set to report its earnings on Thursday, October 30, 2025. Revenues are expected to decline by about 4% to $30.7 billion, per consensus estimates, while earnings are expected to come in at about $1.10 per share. Comcast’s Internet business has been facing headwinds, as wired broadband players see increasing market saturation as well as intense competitive pressure from alternative internet options, especially 5G Fixed Wireless Access provided by mobile carriers. Over Q2, the company lost 226,000 total broadband customers, a majority of which came from its residential operations. That said, Comcast has recently pivoted its broadband strategy to focus on clearer, no-surprise pricing besides also bundling wired and wireless services, while focusing on network enhancements.
See earnings reaction history of all stocks
Comcast’s Historical Odds Of Positive Post-Earnings Return
Some observations on one-day (1D) post-earnings returns:
- The Bear Case: How CMCSA Behaves During Market Shocks
- With Strong Cash Flow, Comcast Stock Poised to Rise?
- Buying CMCSA At A Discount And Getting Paid To Do It
- Comcast Stock Shares $24 Bil Success With Investors
- With Strong Cash Flow, Comcast Stock Poised to Rise?
- Strong Cash Yield: Is Comcast Stock A Buy?
- There are 20 earnings data points recorded over the last five years, with 11 positive and 9 negative one-day (1D) returns observed. In summary, positive 1D returns were seen about 55% of the time.
- Notably, this percentage increases to 58% if we consider data for the last 3 years instead of 5.
- Median of the 11 positive returns = 3.4%, and median of the 9 negative returns = -5.8%
Additional data for observed 5-Day (5D) and 21-Day (21D) returns post earnings are summarized along with the statistics in the table below.
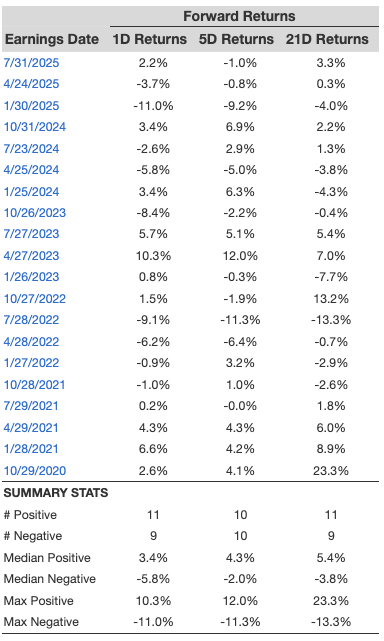
1D, 5D, and 21D Post Earnings Return
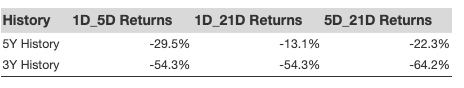
Correlation Between 1D, 5D, and 21D Historical Returns
A relatively less risky strategy (though not useful if the correlation is low) is to understand the correlation between short-term and medium-term returns post earnings, find a pair that has the highest correlation, and execute the appropriate trade. For example, if 1D and 5D show the highest correlation, a trader can position themselves “long” for the next 5 days if the 1D post-earnings return is positive. Here is some correlation data based on a 5-year and a 3-year (more recent) history. Note that the correlation 1D_5D refers to the correlation between 1D post-earnings returns and subsequent 5D returns.
Correlation With Peer Earnings
Learn more about Trefis RV strategy that has outperformed its all-cap stocks benchmark (combination of all 3, the S&P 500, S&P mid-cap, and Russell 2000), to produce strong returns for investors. Separately, if you want upside with a smoother ride than an individual stock like Comcast, consider the High Quality portfolio, which has outperformed the S&P and clocked >105% returns since inception.
Invest with Trefis Market-Beating Portfolios
See all Trefis Price Estimates