Ciena Earnings: Can Historical Patterns Guide Your Trade?

Ciena (NYSE:CIEN), a networking system, software, and services company, is scheduled to report its earnings on Thursday, June 5, 2025. Over the past five years, Ciena’s stock has shown a tendency for negative one-day returns following earnings announcements. Specifically:
- It has experienced a negative one-day return in 55% of instances, with a median decline of -4.2%.
- The maximum one-day negative return observed was -24.3%.
For event-driven traders, understanding these historical patterns can be advantageous, although the actual outcome will largely depend on how the upcoming results align with market consensus and expectations. There are two main strategies to consider for earnings events:
- Pre-Earnings Positioning: Assess the historical probabilities and take a position before the earnings announcement.
- Post-Earnings Positioning: Analyze the correlation between immediate and medium-term returns after the earnings are released, and then adjust your position accordingly.
Analysts project Ciena to report earnings of $0.52 per share on sales of $1.09 billion. This is an increase from the same quarter last year, when the company reported earnings of $0.27 per share on sales of $911 million. Fundamentally, Ciena has a current market capitalization of $11 billion. Over the last twelve months, the company generated $4.0 billion in revenue and was operationally profitable, reporting $184 million in operating profits and a net income of $79 million. That said, if you seek upside with lower volatility than individual stocks, the Trefis High Quality portfolio presents an alternative — having outperformed the S&P 500 and generated returns exceeding 91% since its inception.
See earnings reaction history of all stocks

Image by Gerd Altmann from Pixabay
Ciena’s Historical Odds Of Positive Post-Earnings Return
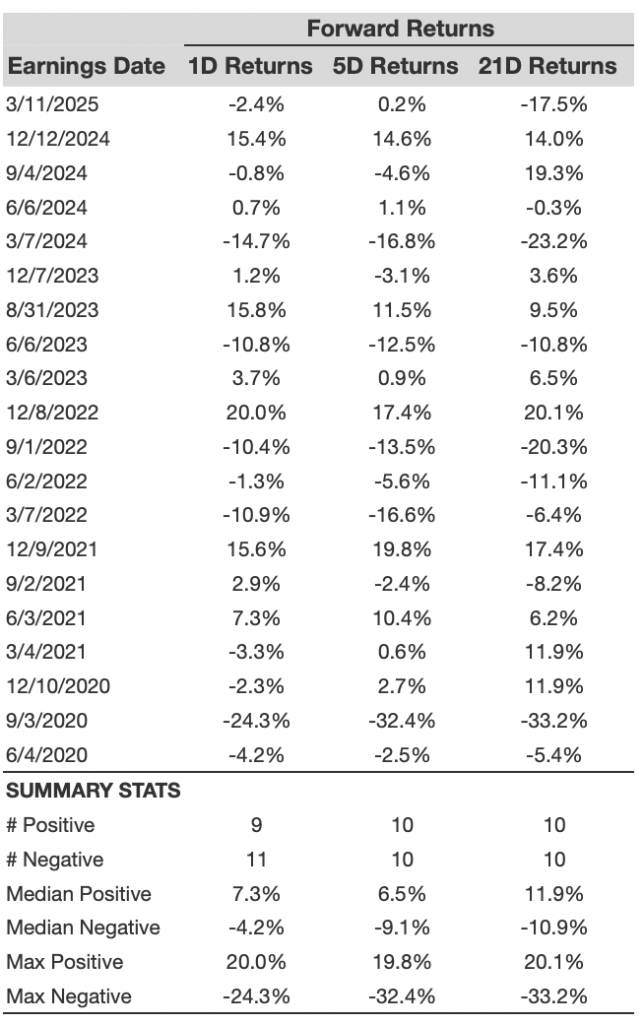
Some observations on one-day (1D) post-earnings returns:
- There are 20 earnings data points recorded over the last five years, with 9 positive and 11 negative one-day (1D) returns observed. In summary, positive 1D returns were seen about 45% of the time.
- Notably, this percentage increases to 55% if we consider data for the last 3 years instead of 5.
- Median of the 9 positive returns = 7.3%, and median of the 11 negative returns = -4.2%
Additional data for observed 5-Day (5D), and 21-Day (21D) returns post earnings are summarized along with the statistics in the table below.
CIEN 1D, 5D, and 21D Post-Earnings Return
Correlation Between 1D, 5D, and 21D Historical Returns
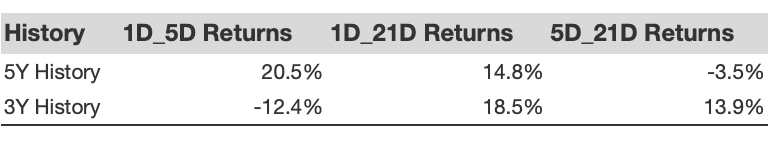
A relatively less risky strategy (though not useful if the correlation is low) is to understand the correlation between short-term and medium-term returns post earnings, find a pair that has the highest correlation, and execute the appropriate trade. For example, if 1D and 5D show the highest correlation, a trader can position themselves “long” for the next 5 days if 1D post-earnings return is positive. Here is some correlation data based on 5-year and 3-year (more recent) history. Note that the correlation 1D_5D refers to the correlation between 1D post-earnings returns and subsequent 5D returns.
CIEN Correlation Between 1D, 5D and 21D Historical Returns
Is There Any Correlation With Peer Earnings?
Sometimes, peer performance can have influence on post-earnings stock reaction. In fact, the pricing-in might begin before the earnings are announced. Here is some historical data on the past post-earnings performance of Ciena stock compared with the stock performance of peers that reported earnings just before Ciena. For fair comparison, peer stock returns also represent post-earnings one-day (1D) returns.
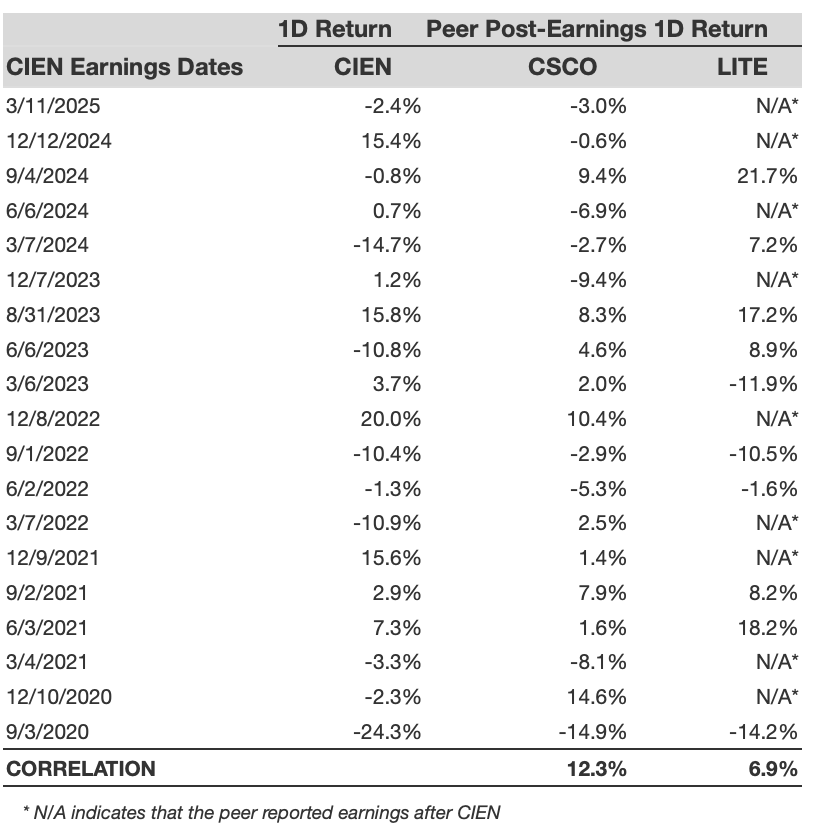
CIEN Correlation With Peer Earnings
Learn more about Trefis RV strategy that has outperformed its all-cap stocks benchmark (combination of all 3, the S&P 500, S&P mid-cap, and Russell 2000), to produce strong returns for investors. Separately, if you want upside with a smoother ride than an individual stock like Ciena, consider the High Quality portfolio, which has outperformed the S&P, and clocked >91% returns since inception.
Invest with Trefis Market-Beating Portfolios
See all Trefis Price Estimates