How Will Burlington’s Stock React To Its Upcoming Earnings?

Burlington Stores (NYSE: BURL) is scheduled to release its fiscal second-quarter earnings on Thursday, August 28, 2025, with analysts projecting earnings of $1.29 per share on $2.63 billion in revenue. This would represent an 11% year-over-year increase in earnings and a 6% growth in sales compared to the prior year’s figures of $1.16 per share and $2.47 billion in revenue. Historically, BURL stock has decreased 55% of the time following earnings announcements, with a median one-day drop of 3.8% and a maximum observed decline of 13%.
BURL is a pure-play off-price retailer (smaller than TJX or Ross but growing). Burlington Stores delivered Q1 FY2025 sales of $2.5B (+6% year-over-year) with flat comps and EPS of $1.67, topping estimates. For Q2, it sees 5–7% sales growth and EPS of $1.20–$1.30, while reaffirming full-year EPS of $8.70–$9.30 and 6–8% sales growth, showing resilience despite tariff and macro pressures. See Buy or Fear Burlington Stock?
The company has $18 Bil in current market capitalization. Revenue over the last twelve months was $11 Bil, and it was operationally profitable with $730 Mil in operating profits and net income of $526 Mil. While a lot will depend on how results stack up against consensus and expectations, understanding historical patterns might just turn the odds in your favor if you are an event-driven trader. Separately check Why Is Coty Stock Down 50%?
For event-driven traders, historical patterns may offer an edge, whether by positioning ahead of earnings or reacting to post-release moves. That said, if you seek upside with lower volatility than from individual stocks, the Trefis High Quality portfolio presents an alternative, having outperformed the S&P 500 and generated returns exceeding 91% since its inception. See earnings reaction history of all stocks.
- How To Earn 9.2% Yield While Waiting to Buy LLY 30% Cheaper
- Could Accenture Stock’s Cash Flow Spark the Next Rally?
- Years of Rewards: $35 Bil From Charter Communications Stock
- McDonald’s Stock Capital Return Hits $35 Bil
- Palo Alto Networks Stock at Support Zone – Bargain or Trap?
- Super Micro Computer Stock Pulls Back to Support – Smart Entry?

Image by Michal Jarmoluk from Pixabay
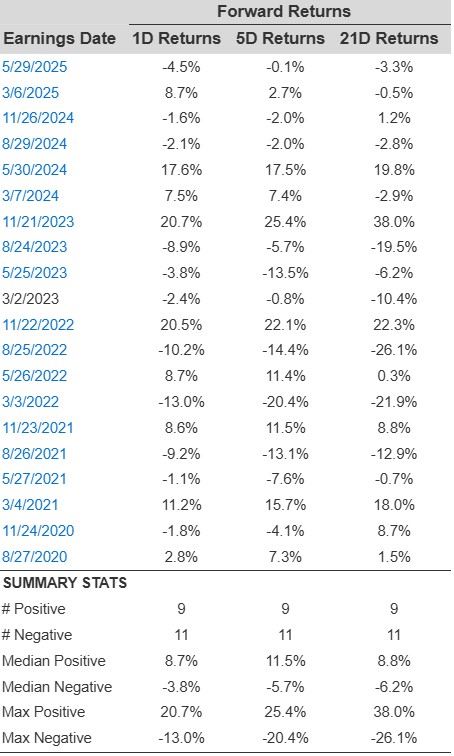
Historical Odds Of Positive Post-Earnings Return
Some observations on one-day (1D) post-earnings returns:
- There are 20 earnings data points recorded over the last five years, with 9 positive and 11 negative one-day (1D) returns observed. In summary, positive 1D returns were seen about 45% of the time.
- Notably, this percentage decreases to 42% if we consider data for the last 3 years instead of 5.
- Median of the 9 positive returns = 8.7%, and median of the 11 negative returns = -3.8%
Additional data for observed 5-Day (5D) and 21-Day (21D) returns post earnings are summarized along with the statistics in the table below.
BURL Correlation Between 1D, 5D, and 21D Forward Returns
Correlation Between 1D, 5D, and 21D Historical Returns
A relatively less risky strategy (though not useful if the correlation is low) is to understand the correlation between short-term and medium-term returns post earnings, find a pair that has the highest correlation, and execute the appropriate trade. For example, if 1D and 5D show the highest correlation, a trader can position themselves “long” for the next 5 days if 1D post-earnings return is positive. Here is some correlation data based on 5-year and 3-year (more recent) history. Note that the correlation 1D_5D refers to the correlation between 1D post-earnings returns and subsequent 5D returns.
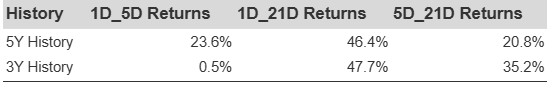
BURL Correlation Between 1D, 5D and 21D Historical Returns
Learn more about Trefis RV strategy that has outperformed its all-cap stocks benchmark (combination of all 3, the S&P 500, S&P mid-cap, and Russell 2000), to produce strong returns for investors.
Invest with Trefis Market-Beating Portfolios