Rebound In Upstream Operations To Lift BP’s 3Q’18 Earnings

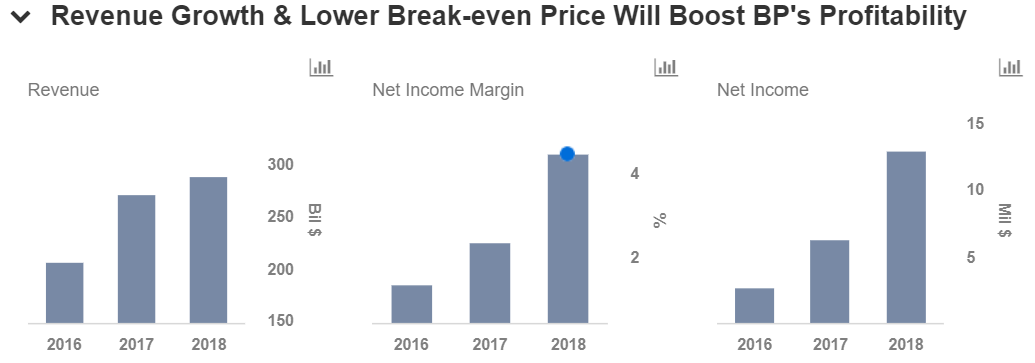
BP Plc. (NYSE:BP) is set to report its financial numbers for the September quarter on 30th October 2018. The European integrated energy company is expected to post a notable improvement in its revenue as well as earnings due to the rebound in commodity prices. Further, the company has successfully commenced several major upstream projects under budget and on or ahead of schedule, which are likely to contribute to its production growth. In addition, the company’s recent acquisition of BHP’s US onshore assets is expected to provide access to high quality assets in the Permian-Delaware, Eagle Ford, and Haynesville basins. Since these are low cost-high margin unconventional plays, this deal is likely to be accretive to the company’s earnings and cash flow and drive its value in the coming years.
We currently have a price estimate of $46 per share for BP, which is higher than its market price. View our interactive dashboard – BP’s Price Estimate – and modify the key drivers to visualize the impact on the company’s valuation.

Key Trends To Watch For In 3Q’18 Results
- Commodity prices witnessed a rebound since the beginning of 2018 due to the extension of the Organization of Petroleum Exporting Countries’ (OPEC) production cuts until the end of 2018. Brent crude oil price rose sharply in the third quarter and averaged $75.07 per barrel, 44% higher compared to the same quarter of last year. Accordingly, we expect BP to see higher price realization for the quarter, which will drive its upstream revenue.
- In line with its expansion strategy, BP has started three major upstream projects year-to-date, under budget and on or ahead of schedule. It aims to begin production from three other projects in 2018 and has made final investment decisions on five projects in Oman, India, the North Sea, and Angola. These projects, coupled with the seven projects commissioned in 2017, will enable the company to deliver a solid production growth in 3Q’18, which will further bolster its upstream revenue.
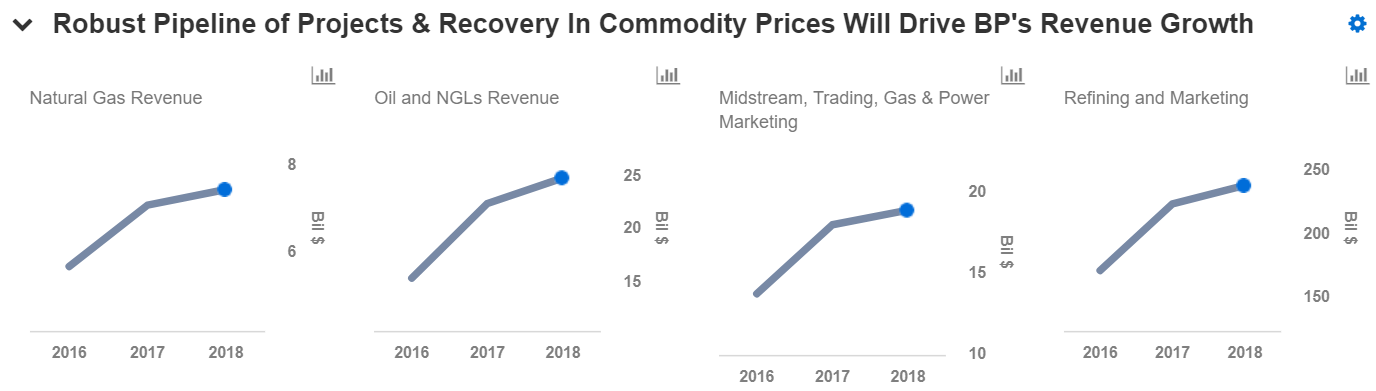
- We expect BP to benefit from the US unconventional oil and gas assets that it acquired from BHP earlier this year. The liquids-rich assets in the Permian-Delaware basin, as well as premium positions in the Eagle Ford and Haynesville basins are expected to be accretive to BP’s earnings and cash flow per share and contribute an additional $1 billion to upstream pre-tax free cash flow by 2021.
- Further, BP’s investments in the advanced mobility space enable it to position itself effectively in the fast-evolving electric vehicle market, while meeting its carbon emission targets. Also, BP’s focus on expanding its presence in major growth markets such as China and Mexico, where it can offer differentiated high quality products and services to its customers, is likely to reap returns in the coming quarters.
- BP plans to maintain a tight organic capital spending budget of $15-17 billion over the medium-term, and gearing ratio within the range of 20-30%. For 2018, the company expects to spend $15 billion in capital investments and generate $3 billion from its divestment program (excluding BHP deal).
- BP had announced a 2.5% increase in its quarterly dividend in the last quarter. At present, the company pays a quarterly dividend of 10.25 cents per ordinary share, or 61.5 cents per ADS. With the improvement in its cash flows, the company could further increase its dividend payments in this quarter.
Do not agree with our forecast? Create your own price forecast for BP by changing the base inputs (blue dots) on our interactive dashboard.
What’s behind Trefis? See How It’s Powering New Collaboration and What-Ifs
For CFOs and Finance Teams | Product, R&D, and Marketing Teams
Like our charts? Explore example interactive dashboards and create your own.