How Will Bank of America Stock React To Its Upcoming Earnings?
Bank of America (NYSE:BAC) is expected to report its earnings on Wednesday, July 16, 2025. Consensus estimates point to revenues of about $26.77 billion for the quarter, up 5.5% year-over-year, while earnings are projected at about $0.87 per share, up from $0.83 in the year-ago period. The company could see its net interest income (NII) – the difference between interest earned on loans and interest paid on deposits – benefit from lower deposit costs and higher-yielding assets. However, the investment banking division may drag on overall performance, with the bank indicating that revenue from the segment could fall by as much as 25% in Q2, as dealmaking likely slowed due to policy uncertainty relating to tariffs.
See earnings reaction history of all stocks
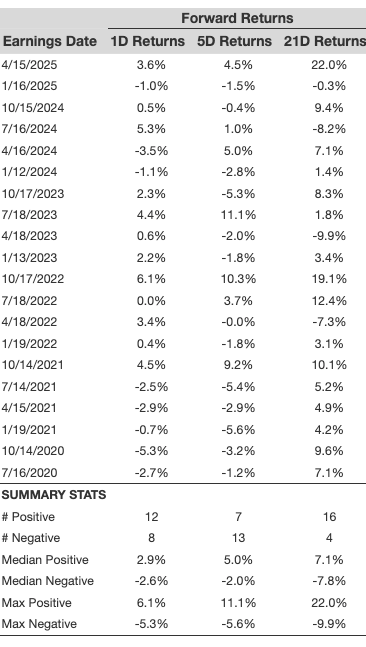
Bank of America’s Historical Odds Of Positive Post-Earnings Return
Some observations on one-day (1D) post-earnings returns:
- There are 20 earnings data points recorded over the last five years, with 12 positive and 8 negative one-day (1D) returns observed. In summary, positive 1D returns were seen about 60% of the time.
- Notably, this percentage increases to 75% if we consider data for the last 3 years instead of 5.
- Median of the 12 positive returns = 2.9%, and median of the 8 negative returns = -2.6%
Additional data for observed 5-Day (5D), and 21-Day (21D) returns post earnings are summarized along with the statistics in the table below.
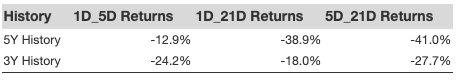
Correlation Between 1D, 5D, and 21D Historical Returns
A relatively less risky strategy (though not useful if the correlation is low) is to understand the correlation between short-term and medium-term returns post earnings, find a pair that has the highest correlation, and execute the appropriate trade. For example, if 1D and 5D show the highest correlation, a trader can position themselves “long” for the next 5 days if 1D post-earnings return is positive. Here is some correlation data based on 5-year and 3-year (more recent) history. Note that the correlation 1D_5D refers to the correlation between 1D post-earnings returns and subsequent 5D returns.
Learn more about Trefis RV strategy that has outperformed its all-cap stocks benchmark (combination of all 3, the S&P 500, S&P mid-cap, and Russell 2000), to produce strong returns for investors. Separately, if you want upside with a smoother ride than an individual stock like Bank of America, consider the High Quality portfolio, which has outperformed the S&P, and clocked >91% returns since inception.
Invest with Trefis Market-Beating Portfolios
See all Trefis Price Estimates