How To Trade American Express Stock Ahead Of Earnings?

American Express (NYSE:AXP) is set to report its earnings on Friday, October 17, 2025. Revenues are likely to come in at $18 billion, up 8.5% year-over-year per consensus estimates, while earnings are likely to come in at about $3.28 per share, up 6.5% compared to last year. Growth is likely to be driven by higher spending by cardholders and rising net card fees, led by higher premium product penetration as well as strong retention rates. The international business could also fare well, supported by higher merchant acceptance.
There are two ways to do that: understand the historical odds and position yourself prior to the earnings release, or look at the correlation between immediate and medium-term returns post earnings and position yourself accordingly after the earnings are released. That said, if you seek upside with lower volatility than individual stocks, the Trefis High Quality portfolio presents an alternative – having outperformed the S&P 500 and generated returns exceeding 105% since its inception.
See earnings reaction history of all stocks
American Express’s Historical Odds Of Positive Post-Earnings Return
Some observations on one-day (1D) post-earnings returns:
- There are 20 earnings data points recorded over the last five years, with 7 positive and 13 negative one-day (1D) returns observed. In summary, positive 1D returns were seen about 35% of the time.
- However, this percentage decreases to 25% if we consider data for the last 3 years instead of 5.
- Median of the 7 positive returns = 6.2%, and median of the 13 negative returns = -2.7%
Additional data for observed 5-Day (5D) and 21-Day (21D) returns post earnings are summarized along with the statistics in the table below.
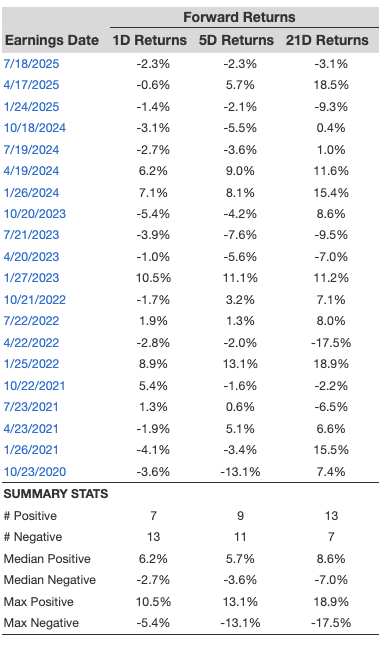
1D, 5D, and 21D Post Earnings Return
Correlation Between 1D, 5D, and 21D Historical Returns
A relatively less risky strategy (though not useful if the correlation is low) is to understand the correlation between short-term and medium-term returns post earnings, find a pair that has the highest correlation, and execute the appropriate trade. For example, if 1D and 5D show the highest correlation, a trader can position themselves “long” for the next 5 days if the 1D post-earnings return is positive. Here is some correlation data based on a 5-year and a 3-year (more recent) history. Note that the correlation 1D_5D refers to the correlation between 1D post-earnings returns and subsequent 5D returns.
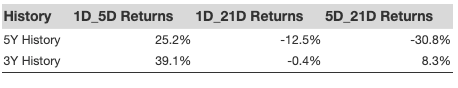
Correlation Between 1D, 5D and 21D Historical Returns
Learn more about Trefis RV strategy that has outperformed its all-cap stocks benchmark (combination of all 3, the S&P 500, S&P mid-cap, and Russell 2000), to produce strong returns for investors. Separately, if you want upside with a smoother ride than an individual stock like American Express, consider the High Quality portfolio, which has outperformed the S&P and clocked 105% returns since inception.
Invest with Trefis Market-Beating Portfolios
See all Trefis Price Estimates