
ResMed (RMD)
Market Price (10/23/2026): $252.0 | Market Cap: $36.5 BilInvestor Relations Sector: Health Care | Industry: Health Care Equipment
ResMed (RMD)
Market Price (10/23/2026): $252.0Market Cap: $36.5 BilSector: Health CareIndustry: Health Care Equipment
Investment Highlights Why It Matters Detailed financial logic regarding cash flow yields vs trend-riding momentum.
Attractive yieldTotal YieldTotal Yield = Earnings Yield + Dividend Yield, Earnings Yield = Net Income / Market Cap Dividend Yield = Total Dividends / Market Cap is 5.1% Attractive operating marginsOp Mgn LTMOperating Margin = Operating Income / Revenue Reflects profitability before taxes and before impact of capital structure (interest payments). is 34% Attractive cash flow generationCFO/Rev LTMCash Flow from Operations / Revenue (Sales), Last Twelve Months (LTM) is 32%, FCF/Rev LTMFree Cash Flow / Revenue (Sales), Last Twelve Months (LTM) is 29% Stock buyback supportStock Buyback 3Y Total is 1.2 Bil Low stock price volatilityVol 12M is 29% Megatrend and thematic driversMegatrends include Digital Health & Telemedicine. Themes include Remote Patient Monitoring, Health Data Analytics, and AI in Healthcare Management. | Weak multi-year price returns2Y Excs Rtn is -23% | Key risksRMD key risks include [1] the erosion of market share gains as a key competitor resolves its product recall and [2] new liabilities and regulatory challenges related to its increasing use of artificial intelligence (AI) in products. |
| Attractive yieldTotal YieldTotal Yield = Earnings Yield + Dividend Yield, Earnings Yield = Net Income / Market Cap Dividend Yield = Total Dividends / Market Cap is 5.1% |
| Attractive operating marginsOp Mgn LTMOperating Margin = Operating Income / Revenue Reflects profitability before taxes and before impact of capital structure (interest payments). is 34% |
| Attractive cash flow generationCFO/Rev LTMCash Flow from Operations / Revenue (Sales), Last Twelve Months (LTM) is 32%, FCF/Rev LTMFree Cash Flow / Revenue (Sales), Last Twelve Months (LTM) is 29% |
| Stock buyback supportStock Buyback 3Y Total is 1.2 Bil |
| Low stock price volatilityVol 12M is 29% |
| Megatrend and thematic driversMegatrends include Digital Health & Telemedicine. Themes include Remote Patient Monitoring, Health Data Analytics, and AI in Healthcare Management. |
| Weak multi-year price returns2Y Excs Rtn is -23% |
| Key risksRMD key risks include [1] the erosion of market share gains as a key competitor resolves its product recall and [2] new liabilities and regulatory challenges related to its increasing use of artificial intelligence (AI) in products. |
Qualitative Assessment
AI Analysis | Feedback
ResMed (RMD) stock has gained about 30% since 6/30/2026 because of the following key factors:
1. Strong Fiscal Q4 2026 Earnings Beat and Optimistic FY27 Outlook. ResMed reported robust financial results for its fourth fiscal quarter, which ended June 30, 2026, on August 6, 2026. The company's non-GAAP diluted earnings per share (EPS) reached $2.95, surpassing analysts' consensus estimates of $2.89 by $0.06. Quarterly revenue increased by 8.6% year-over-year to $1.46 billion, exceeding expectations. Furthermore, ResMed provided an encouraging outlook for fiscal year 2027, guiding for revenue between $5.75 billion and $5.85 billion and non-GAAP EPS of $12 to $12.25, alongside plans for accelerating shareholder returns of over $1.85 billion.
2. Positive Analyst Upgrades and Raised Price Targets. Several financial institutions upgraded ResMed's stock and increased their price targets during the period. Notably, RBC Capital upgraded ResMed from "Sector Perform" to "Outperform" on September 15, 2026, and raised its price target to $262 from $244. KeyBanc also increased its price target for ResMed to $267 from $255, maintaining an "Overweight" rating. These upgrades reflected growing analyst confidence in ResMed's market leadership in obstructive sleep apnea devices, strong Q4 fiscal 2026 results, and future growth prospects.
Show more
ResMed (RMD) stock has gained about 30% since 6/30/2026 because of the following key factors:
1. Strong Fiscal Q4 2026 Earnings Beat and Optimistic FY27 Outlook. ResMed reported robust financial results for its fourth fiscal quarter, which ended June 30, 2026, on August 6, 2026. The company's non-GAAP diluted earnings per share (EPS) reached $2.95, surpassing analysts' consensus estimates of $2.89 by $0.06. Quarterly revenue increased by 8.6% year-over-year to $1.46 billion, exceeding expectations. Furthermore, ResMed provided an encouraging outlook for fiscal year 2027, guiding for revenue between $5.75 billion and $5.85 billion and non-GAAP EPS of $12 to $12.25, alongside plans for accelerating shareholder returns of over $1.85 billion.
2. Positive Analyst Upgrades and Raised Price Targets. Several financial institutions upgraded ResMed's stock and increased their price targets during the period. Notably, RBC Capital upgraded ResMed from "Sector Perform" to "Outperform" on September 15, 2026, and raised its price target to $262 from $244. KeyBanc also increased its price target for ResMed to $267 from $255, maintaining an "Overweight" rating. These upgrades reflected growing analyst confidence in ResMed's market leadership in obstructive sleep apnea devices, strong Q4 fiscal 2026 results, and future growth prospects.
3. Sustained Market Share Gains from Competitor Setbacks. ResMed continued to benefit from the ongoing challenges faced by a major competitor, Philips, following its 2021 recall of respiratory devices. Additionally, the FDA's Class 1 recall of React Health's Luna G3 device provided further tailwinds for ResMed, reducing competitive pressure and enabling the company to solidify its market position and meet sustained demand for its sleep and respiratory care products.
4. Strategic Product Innovation Driving Patient Adherence. ResMed launched its new AirTouch™ F40 Full Face Fabric CPAP Mask in the U.S. in October 2026, with availability starting October 28, 2026. This innovation is designed to enhance patient comfort and adherence to CPAP therapy. Building on previous successes, ResMed's fabric-cushioned masks have shown a 6% increase in 90-day compliance rates compared to silicone-cushioned models, reinforcing the company's commitment to improving patient outcomes and strengthening its product portfolio.
Show less
Stock Movement Drivers
Fundamental Drivers
The 30.2% change in RMD stock from 6/30/2026 to 10/22/2026 was primarily driven by a 29.3% change in the company's P/E Multiple.| (LTM values as of) | 6302026 | 10222026 | Change |
|---|---|---|---|
| Stock Price ($) | 194.32 | 253.06 | 30.2% |
| Change Contribution By: | |||
| Total Revenues ($ Mil) | 5,538 | 5,653 | 2.1% |
| Net Income Margin (%) | 27.4% | 26.9% | -1.8% |
| P/E Multiple | 18.6 | 24.0 | 29.3% |
| Shares Outstanding (Mil) | 145 | 145 | 0.4% |
| Cumulative Contribution | 30.2% |
Market Drivers
6/30/2026 to 10/22/2026| Return | Correlation | |
|---|---|---|
| RMD | 30.2% | |
| Market (SPY) | 2.3% | 8.4% |
| Sector (XLV) | 14.3% | 48.5% |
Fundamental Drivers
The 13.4% change in RMD stock from 3/31/2026 to 10/22/2026 was primarily driven by a 9.7% change in the company's P/E Multiple.| (LTM values as of) | 3312026 | 10222026 | Change |
|---|---|---|---|
| Stock Price ($) | 223.17 | 253.06 | 13.4% |
| Change Contribution By: | |||
| Total Revenues ($ Mil) | 5,398 | 5,653 | 4.7% |
| Net Income Margin (%) | 27.5% | 26.9% | -2.1% |
| P/E Multiple | 21.9 | 24.0 | 9.7% |
| Shares Outstanding (Mil) | 146 | 145 | 0.8% |
| Cumulative Contribution | 13.4% |
Market Drivers
3/31/2026 to 10/22/2026| Return | Correlation | |
|---|---|---|
| RMD | 13.4% | |
| Market (SPY) | 17.8% | 5.1% |
| Sector (XLV) | 24.2% | 51.5% |
Fundamental Drivers
The -6.6% change in RMD stock from 9/30/2025 to 10/22/2026 was primarily driven by a -15.1% change in the company's P/E Multiple.| (LTM values as of) | 9302025 | 10222026 | Change |
|---|---|---|---|
| Stock Price ($) | 270.86 | 253.06 | -6.6% |
| Change Contribution By: | |||
| Total Revenues ($ Mil) | 5,146 | 5,653 | 9.9% |
| Net Income Margin (%) | 27.2% | 26.9% | -1.0% |
| P/E Multiple | 28.3 | 24.0 | -15.1% |
| Shares Outstanding (Mil) | 146 | 145 | 1.2% |
| Cumulative Contribution | -6.6% |
Market Drivers
9/30/2025 to 10/22/2026| Return | Correlation | |
|---|---|---|
| RMD | -6.6% | |
| Market (SPY) | 15.6% | 17.4% |
| Sector (XLV) | 31.9% | 49.1% |
Fundamental Drivers
The 76.3% change in RMD stock from 9/30/2023 to 10/22/2026 was primarily driven by a 33.9% change in the company's Total Revenues ($ Mil).| (LTM values as of) | 9302023 | 10222026 | Change |
|---|---|---|---|
| Stock Price ($) | 143.57 | 253.06 | 76.3% |
| Change Contribution By: | |||
| Total Revenues ($ Mil) | 4,223 | 5,653 | 33.9% |
| Net Income Margin (%) | 21.3% | 26.9% | 26.8% |
| P/E Multiple | 23.5 | 24.0 | 2.2% |
| Shares Outstanding (Mil) | 147 | 145 | 1.6% |
| Cumulative Contribution | 76.3% |
Market Drivers
9/30/2023 to 10/22/2026| Return | Correlation | |
|---|---|---|
| RMD | 76.3% | |
| Market (SPY) | 84.8% | 31.6% |
| Sector (XLV) | 47.5% | 40.5% |
Price Returns Compared
| 2021 | 2022 | 2023 | 2024 | 2025 | 2026 | Total [1] | |
|---|---|---|---|---|---|---|---|
| Returns | |||||||
| RMD Return | 23% | -19% | -17% | 34% | 6% | 3% | 22% |
| Peers Return | 0% | -11% | -12% | 15% | -13% | -2% | -24% |
| S&P 500 Return | 27% | -19% | 24% | 23% | 16% | 12% | 104% |
Monthly Win Rates [3] | |||||||
| RMD Win Rate | 50% | 50% | 58% | 50% | 58% | 50% | |
| Peers Win Rate | 55% | 48% | 48% | 50% | 43% | 52% | |
| S&P 500 Win Rate | 75% | 42% | 67% | 75% | 67% | 50% | |
Max Drawdowns [4] | |||||||
| RMD Max Drawdown | -19% | -27% | -44% | -17% | -20% | -33% | |
| Peers Max Drawdown | -30% | -35% | -41% | -25% | -37% | -34% | |
| S&P 500 Max Drawdown | -5% | -25% | -10% | -8% | -19% | -9% | |
[1] Cumulative total returns since the beginning of 2021
[2] Peers: INSP, INGN, MDT, SYK, BDX. See RMD Returns vs. Peers.
[3] Win Rate = % of calendar months in which monthly returns were positive
[4] Max drawdown represents maximum peak-to-trough decline within a year
[5] 2026 data is for the year up to 10/22/2026 (YTD)
How Low Can It Go
| Event | RMD | S&P 500 |
|---|---|---|
| 2025 US Tariff Shock | ||
| % Loss | -12.8% | -18.8% |
| % Gain to Breakeven | 14.7% | 23.1% |
| Time to Breakeven | 16 days | 79 days |
| Summer-Fall 2023 Five Percent Yield Shock | ||
| % Loss | -38.6% | -9.5% |
| % Gain to Breakeven | 63.0% | 10.5% |
| Time to Breakeven | 199 days | 24 days |
| 2022 Inflation Shock & Fed Tightening | ||
| % Loss | -26.0% | -24.5% |
| % Gain to Breakeven | 35.1% | 32.4% |
| Time to Breakeven | 891 days | 427 days |
| 2020 COVID-19 Crash | ||
| % Loss | -35.3% | -33.7% |
| % Gain to Breakeven | 54.5% | 50.9% |
| Time to Breakeven | 94 days | 140 days |
| Q4 2018 Fed Policy Error / Growth Scare | ||
| % Loss | -12.3% | -19.2% |
| % Gain to Breakeven | 14.0% | 23.8% |
| Time to Breakeven | 37 days | 105 days |
| 2016-2017 Trump Reflation Bond Selloff | ||
| % Loss | -11.4% | -3.7% |
| % Gain to Breakeven | 12.9% | 3.9% |
| Time to Breakeven | 71 days | 6 days |
In The Past
ResMed's stock fell -12.8% during the 2025 US Tariff Shock. Such a loss loss requires a 14.7% gain to breakeven.
Preserve Wealth
Limiting losses and compounding gains is essential to preserving wealth.
Asset Allocation
Actively managed asset allocation strategies protect wealth. Learn more.
| Event | RMD | S&P 500 |
|---|---|---|
| Summer-Fall 2023 Five Percent Yield Shock | ||
| % Loss | -38.6% | -9.5% |
| % Gain to Breakeven | 63.0% | 10.5% |
| Time to Breakeven | 199 days | 24 days |
| 2022 Inflation Shock & Fed Tightening | ||
| % Loss | -26.0% | -24.5% |
| % Gain to Breakeven | 35.1% | 32.4% |
| Time to Breakeven | 891 days | 427 days |
| 2020 COVID-19 Crash | ||
| % Loss | -35.3% | -33.7% |
| % Gain to Breakeven | 54.5% | 50.9% |
| Time to Breakeven | 94 days | 140 days |
| 2008-2009 Global Financial Crisis | ||
| % Loss | -43.6% | -53.4% |
| % Gain to Breakeven | 77.2% | 114.4% |
| Time to Breakeven | 409 days | 1085 days |
In The Past
ResMed's stock fell -12.8% during the 2025 US Tariff Shock. Such a loss loss requires a 14.7% gain to breakeven.
Preserve Wealth
Limiting losses and compounding gains is essential to preserving wealth.
Asset Allocation
Actively managed asset allocation strategies protect wealth. Learn more.
About ResMed (RMD)
ResMed Inc. (RMD) is a global medical device company specializing in developing, manufacturing, and marketing solutions for respiratory disorders and out-of-hospital care. The company operates in two main segments: Sleep and Respiratory Care, and Software as a Service. Its mission is to improve patient outcomes through innovative medical devices and digital health solutions.
In its Sleep and Respiratory Care segment, ResMed provides a comprehensive suite of products for conditions like sleep apnea and other respiratory disorders. This includes ventilation devices, diagnostic products, and various mask systems with associated accessories. Complementing its hardware, ResMed offers cloud-based software such as AirView for remote patient monitoring, myAir for personalized therapy management, and U-Sleep for streamlining compliance monitoring for home medical equipment (HME) providers.
Beyond respiratory devices, ResMed is a significant provider of out-of-hospital software solutions through its Software as a Service segment. These include Brightree for business management across various post-acute care settings like HME and pharmacy, MatrixCare for care management in senior living and skilled nursing facilities, and HEALTHCAREfirst for electronic health records and analytics in home health and hospice. ResMed markets its products and services primarily to sleep clinics, home healthcare dealers, and hospitals across approximately 140 countries.
AI Analysis | Feedback
The high-tech Dyson for medical breathing and sleep devices.
A specialized Salesforce for out-of-hospital healthcare management.
AI Analysis | Feedback
ResMed (RMD) offers a range of medical devices and cloud-based software solutions:
- Ventilation Devices: Medical devices providing respiratory support for various conditions.
- Diagnostic Products: Devices used for diagnosing respiratory disorders.
- Mask Systems: Essential components for delivering respiratory therapy in both hospital and home settings.
- Headgear and Other Accessories: Complementary items for mask systems and other medical devices.
- Dental Devices: Specialized devices used in dentistry, often for sleep-related issues.
- Connectivity Modules and Propeller Solutions: Components designed to enhance device connectivity and functionality.
- Cloud-based Informatics Solutions: Software platforms for managing patient outcomes and data related to respiratory care.
- AirView: A cloud-based system facilitating remote monitoring and adjustment of patients' device settings.
- myAir: A personalized mobile application for sleep apnea patients providing therapy management, support, and education.
- U-Sleep: A compliance monitoring solution helping home medical equipment (HME) providers streamline their sleep therapy programs.
- Brightree: Business management software and service solutions for out-of-hospital care providers including HME, pharmacy, and home infusion.
- MatrixCare: Comprehensive care management software and ancillary solutions for senior living, skilled nursing, and various home care agencies.
- HEALTHCAREfirst: Electronic health record (EHR) software, billing, coding, and analytics services specifically for home health and hospice agencies.
AI Analysis | Feedback
ResMed (RMD) sells primarily to other companies and organizations within the healthcare sector. Its major customers, categorized by the types of businesses they represent, include:
- Sleep clinics
- Home Healthcare Dealers (also known as Home Medical Equipment or HME providers)
- Hospitals
- Distributors
- Various out-of-hospital care providers, particularly for its software solutions, including:
- Senior living, skilled nursing, and life plan communities
- Home health, home care, and hospice agencies
- Pharmacy, home infusion, orthotics, and prosthetics services providers
- Accountable care organizations
The provided company description does not include specific names of customer companies or their public symbols.
AI Analysis | Feedback
AI Analysis | Feedback
Michael "Mick" Farrell, Chief Executive Officer and Chairman of the Board
Mick Farrell was appointed ResMed's CEO in March 2013 and became Chairman of the Board in January 2023. He joined ResMed in 2000 and served in various senior leadership roles, including president of the Americas region from 2011 to 2013, and senior vice president of the global sleep apnea business unit from 2007 to 2011. Before joining ResMed, Mr. Farrell worked in management consulting, biotechnology, chemicals, and metals manufacturing at companies such as Arthur D. Little, Genzyme Corporation (now part of Sanofi), The Dow Chemical Company, and BHP Billiton. He serves on the board of directors for the Advanced Medical Technology Association (AdvaMed) and Zimmer Biomet. He is the son of ResMed's founder, Dr. Peter Farrell.
Brett Sandercock, Chief Financial Officer
Brett Sandercock was appointed Chief Financial Officer in January 2006. His previous roles at ResMed include vice president of Treasury and Finance from 2004 to 2005, and group accountant and controller from 1998 to 2004. Prior to ResMed, Mr. Sandercock was a manager of Financial Accounting and Group Reporting at Norton Abrasives, a division of Saint-Gobain, and held finance and accounting positions at Health Care of Australia. He also worked at PricewaterhouseCoopers in Sydney, specializing in audits across various industries. From June 2019 to August 2021, he served as non-executive chairman of the board of directors of Osteopore Limited.
Justin Leong, Chief Product Officer
Justin Leong was appointed Chief Product Officer in November 2023, leading the development of a global portfolio of products, services, and business models. He joined ResMed in 2013 as vice president of Global Strategy and has held various roles, including president of Asia Growth Markets and senior vice president for Asia and Latin America. Before joining ResMed, Mr. Leong was a director at London-based private equity firm HgCapital from 2006 to 2012, where he was responsible for acquisitions, portfolio management, and served on the board of several European healthcare companies. Earlier in his career, he was a management consultant with Bain & Co. in Sydney, Boston, and New York.
Michael Rider, Chief Legal Officer
Michael Rider was appointed Chief Legal Officer in July 2023. He guides global legal strategy on intellectual property management, antitrust, anti-kickback, corporate governance, acquisitions, privacy, and litigation. He previously served as ResMed's senior vice president, deputy global general counsel, and legal business partner for ResMed's Sleep & Respiratory Care team from 2019 to 2023, and as vice president and general counsel-Americas since joining ResMed in 2012. Mr. Rider has nearly 40 years of legal experience, including serving as senior vice president, general counsel for Callaway Golf, senior attorney for American Airlines, and a litigation associate at Gibson Dunn & Crutcher.
Kylie Canaday, Chief Strategy Officer
Kylie Canaday was appointed Chief Strategy Officer in January 2026, responsible for the company's global corporate strategy and enterprise-wide strategic development. She has over 15 years of experience at ResMed, holding several senior leadership roles, including Vice President of Financial Planning & Analysis, Vice President of Corporate Strategy, Vice President of SaaS Strategy and Business Development, and Chief of Staff to the Executive Team. In these roles, she has driven strategic initiatives supporting ResMed's growth, digital transformation, and business development.
AI Analysis | Feedback
The key risks to ResMed's business (RMD) include the emerging threat from weight-loss drugs, an increasingly competitive and complex regulatory landscape, and ongoing supply chain vulnerabilities.
-
GLP-1 Competitive Risk: The primary and most significant emerging risk for ResMed stems from the potential impact of GLP-1 (Glucagon-like peptide-1) weight-loss drugs. As obesity is a major risk factor for obstructive sleep apnea (OSA), the approval of these drugs for treating OSA could lead to a meaningful reduction in demand for ResMed's core product offerings, such as CPAP (Continuous Positive Airway Pressure) therapy devices and associated consumables. This new class of therapeutics poses a direct challenge to the underlying demand for ResMed's devices, potentially altering the landscape of sleep apnea treatment.
-
Market Competition and Regulatory Risks: ResMed operates in a highly competitive environment, and the normalization of the competitive landscape, especially with competitors like Philips Respironics rebuilding after past regulatory issues, could lead to market share stabilization and increased pricing pressure. Furthermore, an evolving regulatory landscape and reimbursement uncertainty present ongoing challenges. Changes in global safety standards, stricter compliance costs, and shifts in reimbursement policies from Medicare or private insurers for sleep devices and remote patient monitoring could negatively impact ResMed's margins, operational expenses, and patient access to its products.
-
Supply Chain Vulnerabilities: ResMed has acknowledged and faced difficulties due to global supply chain disruptions, which have previously resulted in issues like "decommitment" on component purchase orders and the need to recalibrate sales forecasts. Despite ongoing efforts to diversify suppliers and improve supply chain resilience, including investments in new distribution centers, the company remains sensitive to disruptions caused by factors such as component shortages, geopolitical conflicts, and potential tariffs, particularly given that a significant portion of its revenue is generated outside North America.
AI Analysis | Feedback
AI Analysis | Feedback
ResMed (symbol: RMD) operates in several large addressable markets for its main products and services across sleep and respiratory care, and software as a service (SaaS).
Sleep and Respiratory Care Products
- The total addressable market (TAM) for ResMed's portfolio of products, which includes solutions for sleep apnea, insomnia, and chronic obstructive pulmonary disease (COPD), is estimated by management to be over 2.3 billion people globally.
- For sleep apnea specifically, the global addressable market encompasses over 1 billion people.
- For insomnia, the global addressable market includes 860 million people.
- For chronic obstructive pulmonary disease (COPD), the global addressable market is 480 million people.
- The global sleep apnea devices market is projected to grow from $9.7 billion in 2025 to $24.4 billion by 2035. In 2025, the sleep apnea devices market was valued at approximately $7.11 billion. Another source indicates the sleep apnea devices market was valued at approximately USD 9.70 billion in 2024 and is expected to reach USD 10.30 billion in 2025.
- The North American sleep apnea devices market was valued at USD 3.26 billion in 2025 and represented approximately 49.28% of the global market in 2024.
- The global COPD treatment market was valued at USD 22.32 billion in 2024, with projections indicating a rise to USD 23.26 billion by 2025. North America led the COPD market with a 38.60% share in 2024.
Software as a Service (SaaS)
- ResMed's SaaS business is a significant and growing segment, with its Residential Care Software (RCS) segment accounting for 51% of its Q2 FY26 revenue.
- The company's digital health ecosystem connects a large patient base; it has a network of more than 34 million patients on its AirView platform.
- ResMed's residential care software network includes more than 170 million accounts.
- By 2025, ResMed manages over 18 million devices and influences more than 170 million lives through its SaaS and data analytics.
AI Analysis | Feedback
AI Analysis | Feedback
Share Repurchases
- ResMed repurchased 419,000 shares for $100 million in the fourth quarter of fiscal year 2025 as part of its capital management.
- The company planned to increase its share buyback program to $100 million per quarter starting in Q4 FY2025, up from $75 million in Q3 FY2025.
- Over $610 million was returned to shareholders in fiscal year 2025 through a combination of dividends and share repurchases.
Share Issuance
- On November 19, 2025, stockholders approved an amendment to the 2009 Incentive Award Plan, increasing the number of common shares reserved for issuance by 2,400,000.
- The 2018 Employee Stock Purchase Plan was also amended on November 19, 2025, adding 3 million shares.
- Common stock issuance, net of taxes, for the twelve months ending December 31, 2025, was approximately $77.0 million (sum of $29.6M (Dec 2025), $8.2M (Sep 2025), $30.2M (Jun 2025), $9.0M (Mar 2025)).
Outbound Investments
- ResMed acquired VirtuOx, a leading independent diagnostic testing facility, for $140 million in May 2025, expanding its presence in home sleep apnea testing and virtual care.
- The company acquired the German-based MEDIFOX DAN group for approximately $1 billion, which significantly expanded its software portfolio for out-of-hospital care.
- ResMed acquired Inhealthcare in June 2024, further expanding its portfolio of digital health solutions.
Capital Expenditures
- Capital expenditures for fiscal year 2025 were approximately $90 million.
- For the last twelve months ending in February 2026, capital expenditures were approximately $122.89 million.
- Expected capital expenditures are forecast to be $146.2 million for 2026, $157.3 million for 2027, and $168.5 million for 2028, with a focus on expanding U.S. manufacturing with a new facility in Calabasas, California, and strengthening distribution capacity in North America with a new hub in Greenwood, Indiana, scheduled to open in 2027.
Peer Outperformance in Health Care Equipment
| Ticker | Name | Rev Growth 3Y Avg | P/E | 1Y | 3Y | 5Y | 5Y Gap |
|---|---|---|---|---|---|---|---|
| RMD | ResMed | 10.2% | 24.0x | -4.0% | 77.8% | -1.0% | — |
| ITGR | Integer | 8.4% | 33.5x | 16.0% | 77.4% | 38.2% | +39pp |
| Industry | Names | 1Y med | 3Y med | 5Y med | Top 3 by 5Y |
|---|---|---|---|---|---|
| Health Care Distributors | 6 | 15.4% | 55.7% | 98.5% | CAH 471% · MCK 396% · COR 189% |
| Health Care Services | 20 | 19.4% | 46.6% | 16.2% | HIMS 284% · RDNT 123% · DGX 83% |
| Health Care Facilities | 24 | 1.1% | 19.2% | 5.8% | NHC 289% · THC 283% · ENSG 150% |
| Managed Health Care | 8 | 39.7% | 2.1% | 3.2% | OSCR 96% · HQY 49% · ELV 11% |
| Health Care Equipment ← | 50 | -3.1% | 6.3% | -12.6% | UFPT 374% · GKOS 293% · TMDX 163% |
| Pharmaceuticals | 61 | -11.9% | 5.1% | -33.1% | LQDA 1006% · KNSA 654% · CORT 474% |
| Health Care Supplies | 11 | 20.8% | -3.2% | -38.6% | LNTH 341% · HAE 62% · MMSI 30% |
| Life Sciences Tools & Services | 109 | -10.1% | -10.2% | -67.3% | MEDP 250% · NTRA 249% · IRTC 76% |
| Biotechnology | 364 | -22.7% | -23.5% | -80.8% | DNTH 1103% · ELVN 1075% · TRVI 961% |
| Health Care Technology | 22 | -26.5% | -63.2% | -82.3% | VEEV 1% · DOCS -48% |
Latest Trefis Analyses
Research & Analysis
Invest in Strategies
Wealth Management
Peer Comparisons
| Peers to compare with: |
Financials
| Median | |
|---|---|
| Name | |
| Mkt Price | 148.79 |
| Mkt Cap | 45.8 |
| Rev LTM | 14,452 |
| Op Inc LTM | 2,626 |
| FCF LTM | 2,069 |
| FCF 3Y Avg | 2,145 |
| CFO LTM | 2,534 |
| CFO 3Y Avg | 2,570 |
Growth & Margins
| Median | |
|---|---|
| Name | |
| Rev Chg LTM | 9.1% |
| Rev Chg 3Y Avg | 8.5% |
| Rev Chg Q | 7.0% |
| QoQ Delta Rev Chg LTM | 1.6% |
| Op Inc Chg LTM | 16.8% |
| Op Inc Chg 3Y Avg | 13.5% |
| Op Mgn LTM | 16.7% |
| Op Mgn 3Y Avg | 16.0% |
| QoQ Delta Op Mgn LTM | 0.3% |
| CFO/Rev LTM | 19.4% |
| CFO/Rev 3Y Avg | 18.0% |
| FCF/Rev LTM | 14.7% |
| FCF/Rev 3Y Avg | 14.6% |
Valuation
| Median | |
|---|---|
| Name | |
| Mkt Cap | 45.8 |
| P/S | 2.8 |
| P/Op Inc | 18.2 |
| P/EBIT | 19.8 |
| P/E | 23.8 |
| P/CFO | 16.2 |
| Total Yield | 4.7% |
| Dividend Yield | 1.0% |
| FCF Yield 3Y Avg | 4.3% |
| D/E | 0.1 |
| Net D/E | 0.0 |
Returns
| Median | |
|---|---|
| Name | |
| 1M Rtn | 11.0% |
| 3M Rtn | 25.3% |
| 6M Rtn | 16.5% |
| 12M Rtn | -8.1% |
| 3Y Rtn | 33.9% |
| 1M Excs Rtn | 12.1% |
| 3M Excs Rtn | 19.9% |
| 6M Excs Rtn | 8.7% |
| 12M Excs Rtn | -22.7% |
| 3Y Excs Rtn | -45.4% |
Comparison Analyses
Segment Financials
Revenue by Segment| $ Mil | 2026 | 2025 | 2024 | 2023 | 2022 |
|---|---|---|---|---|---|
| Sleep and Breathing Health | 4,978 | 4,505 | 4,101 | 3,725 | 3,177 |
| Residential Care Software | 676 | 641 | 584 | 498 | 401 |
| Total | 5,653 | 5,146 | 4,685 | 4,223 | 3,578 |
| $ Mil | 2026 | 2025 | 2024 | 2023 | 2022 |
|---|---|---|---|---|---|
| Sleep and Breathing Health | 2,204 | 1,964 | 1,681 | 1,447 | 1,280 |
| Residential Care Software | 218 | 205 | 154 | 116 | 94 |
| Masks with magnets field safety notification expenses | 0 | 2 | -6 | 0 | 0 |
| Acquisition and portfolio review related expenses | -11 | -2 | 0 | -11 | -2 |
| Restructuring expenses | -22 | 0 | -64 | -9 | 0 |
| Astral field safety notification expenses | -42 | 0 | -8 | 0 | 0 |
| Amortization of acquired intangible assets | -77 | -77 | -79 | -72 | -71 |
| Corporate costs | -383 | -406 | -358 | -338 | -300 |
| Total | 1,887 | 1,685 | 1,320 | 1,132 | 1,000 |
Price Behavior
| Market Price | $253.06 | |
| Market Cap ($ Bil) | 36.6 | |
| First Trading Date | 06/02/1995 | |
| Distance from 52W High | -7.5% | |
| 50 Days | 200 Days | |
| DMA Price | $228.95 | $224.17 |
| DMA Trend | up | down |
| Distance from DMA | 10.5% | 12.9% |
| 3M | 1YR | |
| Volatility | 29.3% | 28.8% |
| Downside Capture | -38.19 | 55.07 |
| Upside Capture | 84.25 | 33.78 |
| Correlation (S&P 500) | 4.8% | 17.1% |
| 1M | 2M | 3M | 6M | 1Y | 3Y | |
|---|---|---|---|---|---|---|
| Beta | 0.04 | 0.54 | 0.33 | 0.16 | 0.41 | 0.67 |
| Up Beta | -0.39 | 0.35 | -0.67 | 0.36 | 0.28 | 0.69 |
| Down Beta | 0.52 | 1.94 | 0.67 | 0.38 | 0.44 | 0.49 |
| Up Capture | -35% | 55% | 83% | 1% | 20% | 45% |
| Bmk +ve Days | 6 | 16 | 27 | 66 | 132 | 424 |
| Stock +ve Days | 7 | 20 | 32 | 62 | 123 | 388 |
| Down Capture | 98% | 18% | 17% | 5% | 69% | 90% |
| Bmk -ve Days | 16 | 26 | 37 | 60 | 120 | 328 |
| Stock -ve Days | 15 | 22 | 32 | 64 | 129 | 364 |
[1] Upside and downside betas calculated using positive and negative benchmark daily returns respectively
Based On 1-Year Data
| Annualized Return | Annualized Volatility | Sharpe Ratio | Correlation with RMD | |
|---|---|---|---|---|
| RMD | -4.7% | 28.8% | -0.17 | - |
| Sector ETF (XLV) | 26.6% | 16.3% | 1.26 | 50.9% |
| Equity (SPY) | 14.8% | 12.7% | 0.80 | 16.2% |
| Gold (GLD) | -2.2% | 28.4% | -0.09 | 13.3% |
| Commodities (DBC) | 52.1% | 20.7% | 1.91 | -15.1% |
| Real Estate (VNQ) | 4.7% | 13.9% | 0.08 | 36.7% |
| Bitcoin (BTCUSD) | -22.4% | 43.4% | -0.47 | 8.2% |
Smart multi-asset allocation framework can stack odds in your favor. Learn How
Based On 5-Year Data
| Annualized Return | Annualized Volatility | Sharpe Ratio | Correlation with RMD | |
|---|---|---|---|---|
| RMD | 0.8% | 31.8% | 0.06 | - |
| Sector ETF (XLV) | 9.0% | 15.3% | 0.39 | 46.5% |
| Equity (SPY) | 13.0% | 17.1% | 0.57 | 41.6% |
| Gold (GLD) | 17.1% | 18.9% | 0.72 | 11.9% |
| Commodities (DBC) | 9.3% | 19.5% | 0.36 | 5.4% |
| Real Estate (VNQ) | 1.1% | 18.9% | -0.05 | 40.7% |
| Bitcoin (BTCUSD) | 8.0% | 51.7% | 0.33 | 16.5% |
Smart multi-asset allocation framework can stack odds in your favor. Learn How
Based On 10-Year Data
| Annualized Return | Annualized Volatility | Sharpe Ratio | Correlation with RMD | |
|---|---|---|---|---|
| RMD | 16.0% | 31.8% | 0.54 | - |
| Sector ETF (XLV) | 11.8% | 16.7% | 0.58 | 52.8% |
| Equity (SPY) | 15.4% | 17.9% | 0.73 | 49.7% |
| Gold (GLD) | 11.9% | 16.4% | 0.59 | 11.0% |
| Commodities (DBC) | 8.3% | 18.1% | 0.37 | 12.1% |
| Real Estate (VNQ) | 5.2% | 20.7% | 0.21 | 41.6% |
| Bitcoin (BTCUSD) | 63.0% | 66.2% | 1.03 | 12.2% |
Smart multi-asset allocation framework can stack odds in your favor. Learn How
Returns Analyses
Earnings Returns History
Updated 9/9/2026| Forward Returns | |||
|---|---|---|---|
| Earnings Date | 1D Returns | 5D Returns | 21D Returns |
| 8/6/2026 | -5.1% | 1.6% | 2.6% |
| 4/30/2026 | -4.1% | -3.2% | -12.5% |
| 1/29/2026 | 0.3% | 3.7% | 0.1% |
| 10/30/2025 | -2.1% | -1.0% | -0.3% |
| 7/31/2025 | 2.7% | 3.0% | 1.2% |
| 4/23/2025 | 10.1% | 10.3% | 14.7% |
| 1/30/2025 | -8.3% | -7.9% | -9.3% |
| 10/24/2024 | 7.1% | 1.4% | 2.2% |
| ... | |||
| SUMMARY STATS | |||
| # Positive | 10 | 12 | 12 |
| # Negative | 14 | 12 | 12 |
| Median Positive | 6.9% | 4.5% | 10.1% |
| Median Negative | -4.6% | -3.9% | -4.2% |
| Max Positive | 18.9% | 18.9% | 17.0% |
| Max Negative | -18.5% | -19.5% | -27.4% |
| Forward Returns | |||
|---|---|---|---|
| Earnings Date | 1D Returns | 5D Returns | 21D Returns |
| 8/6/2026 | -5.1% | 1.6% | 2.6% |
| 4/30/2026 | -4.1% | -3.2% | -12.5% |
| 1/29/2026 | 0.3% | 3.7% | 0.1% |
| 10/30/2025 | -2.1% | -1.0% | -0.3% |
| 7/31/2025 | 2.7% | 3.0% | 1.2% |
| 4/23/2025 | 10.1% | 10.3% | 14.7% |
| 1/30/2025 | -8.3% | -7.9% | -9.3% |
| 10/24/2024 | 7.1% | 1.4% | 2.2% |
| 8/1/2024 | 4.2% | -0.2% | 14.5% |
| 4/25/2024 | 18.9% | 18.9% | 16.5% |
| 1/24/2024 | 8.5% | 10.7% | 7.4% |
| 10/26/2023 | -2.9% | 8.2% | 10.3% |
| 8/3/2023 | -18.5% | -19.5% | -27.4% |
| 4/27/2023 | 7.0% | 3.0% | -4.2% |
| 1/26/2023 | -3.3% | -2.4% | -8.6% |
| 10/27/2022 | -5.8% | -10.1% | -2.7% |
| 8/11/2022 | -0.4% | -1.8% | -1.0% |
| 4/28/2022 | -6.3% | -4.6% | -2.2% |
| 1/27/2022 | -3.9% | 5.4% | 9.9% |
| 10/28/2021 | -2.1% | -2.2% | -4.2% |
| 8/5/2021 | 2.7% | 2.9% | 10.8% |
| 4/29/2021 | -9.6% | -7.1% | -0.8% |
| 1/28/2021 | -6.7% | -5.5% | -9.2% |
| 10/29/2020 | 6.9% | 18.6% | 17.0% |
| SUMMARY STATS | |||
| # Positive | 10 | 12 | 12 |
| # Negative | 14 | 12 | 12 |
| Median Positive | 6.9% | 4.5% | 10.1% |
| Median Negative | -4.6% | -3.9% | -4.2% |
| Max Positive | 18.9% | 18.9% | 17.0% |
| Max Negative | -18.5% | -19.5% | -27.4% |
SEC Filings
Expand for More| Report Date | Filing Date | Filing |
|---|---|---|
| 06/30/2026 | 08/13/2026 | 10-K |
| 03/31/2026 | 05/01/2026 | 10-Q |
| 12/31/2025 | 01/30/2026 | 10-Q |
| 09/30/2025 | 10/31/2025 | 10-Q |
| 06/30/2025 | 08/08/2025 | 10-K |
| 03/31/2025 | 04/24/2025 | 10-Q |
| 12/31/2024 | 01/31/2025 | 10-Q |
| 09/30/2024 | 10/25/2024 | 10-Q |
| 06/30/2024 | 08/09/2024 | 10-K |
| 03/31/2024 | 04/26/2024 | 10-Q |
| 12/31/2023 | 01/25/2024 | 10-Q |
| 09/30/2023 | 10/27/2023 | 10-Q |
| 06/30/2023 | 08/11/2023 | 10-K |
| 03/31/2023 | 04/28/2023 | 10-Q |
| 12/31/2022 | 01/27/2023 | 10-Q |
| 09/30/2022 | 10/28/2022 | 10-Q |
| Report Date | Filing Date | Filing |
|---|---|---|
| 06/30/2026 | 08/13/2026 | 10-K |
| 03/31/2026 | 05/01/2026 | 10-Q |
| 12/31/2025 | 01/30/2026 | 10-Q |
| 09/30/2025 | 10/31/2025 | 10-Q |
| 06/30/2025 | 08/08/2025 | 10-K |
| 03/31/2025 | 04/24/2025 | 10-Q |
| 12/31/2024 | 01/31/2025 | 10-Q |
| 09/30/2024 | 10/25/2024 | 10-Q |
| 06/30/2024 | 08/09/2024 | 10-K |
| 03/31/2024 | 04/26/2024 | 10-Q |
| 12/31/2023 | 01/25/2024 | 10-Q |
| 09/30/2023 | 10/27/2023 | 10-Q |
| 06/30/2023 | 08/11/2023 | 10-K |
| 03/31/2023 | 04/28/2023 | 10-Q |
| 12/31/2022 | 01/27/2023 | 10-Q |
| 09/30/2022 | 10/28/2022 | 10-Q |
| 06/30/2022 | 08/12/2022 | 10-K |
| 03/31/2022 | 04/29/2022 | 10-Q |
| 12/31/2021 | 01/28/2022 | 10-Q |
| 09/30/2021 | 10/29/2021 | 10-Q |
| 06/30/2021 | 08/17/2021 | 10-K |
| 03/31/2021 | 04/30/2021 | 10-Q |
| 12/31/2020 | 01/29/2021 | 10-Q |
| 09/30/2020 | 10/30/2020 | 10-Q |
| 06/30/2020 | 08/13/2020 | 10-K |
| 03/31/2020 | 05/01/2020 | 10-Q |
| 12/31/2019 | 01/31/2020 | 10-Q |
| 09/30/2019 | 10/25/2019 | 10-Q |
Insider Activity
Updated 10/8/2026| # | Owner | Title | Holding | Action | Filing Date | Price | Shares | Transacted Value | Value of Held Shares | Form |
|---|---|---|---|---|---|---|---|---|---|---|
| 1 | Farrell, Michael J | Chairman and CEO | Direct | Sell | 10082026 | 226.33 | 4,991 | 1,129,637 | 108,596,164 | Form |
| 2 | Farrell, Michael J | Chairman and CEO | Direct | Sell | 9092026 | 222.44 | 4,991 | 1,110,191 | 103,713,285 | Form |
| 3 | Farrell, Peter C | Direct | Sell | 9032026 | 234.73 | 970 | 227,688 | 12,159,718 | Form | |
| 4 | Farrell, Michael J | Chairman and CEO | Direct | Sell | 8102026 | 205.69 | 4,991 | 1,026,596 | 95,903,964 | Form |
| 5 | Farrell, Peter C | Direct | Sell | 8062026 | 225.00 | 8,000 | 1,800,000 | 11,873,925 | Form |
| # | Owner | Title | Holding | Action | Filing Date | Price | Shares | Transacted Value | Value of Held Shares | Form |
|---|---|---|---|---|---|---|---|---|---|---|
| 1 | Farrell, Michael J | Chairman and CEO | Direct | Sell | 10082026 | 226.33 | 4,991 | 1,129,637 | 108,596,164 | Form |
| 2 | Farrell, Michael J | Chairman and CEO | Direct | Sell | 9092026 | 222.44 | 4,991 | 1,110,191 | 103,713,285 | Form |
| 3 | Farrell, Peter C | Direct | Sell | 9032026 | 234.73 | 970 | 227,688 | 12,159,718 | Form | |
| 4 | Farrell, Michael J | Chairman and CEO | Direct | Sell | 8102026 | 205.69 | 4,991 | 1,026,596 | 95,903,964 | Form |
| 5 | Farrell, Peter C | Direct | Sell | 8062026 | 225.00 | 8,000 | 1,800,000 | 11,873,925 | Form | |
| 6 | Farrell, Michael J | Chairman and CEO | Direct | Sell | 7082026 | 218.55 | 4,991 | 1,090,771 | 101,891,871 | Form |
| 7 | Farrell, Michael J | Chairman and CEO | Direct | Sell | 6092026 | 193.96 | 4,991 | 968,064 | 90,435,946 | Form |
| 8 | Farrell, Michael J | Chairman and CEO | Direct | Sell | 5112026 | 207.82 | 4,991 | 1,037,233 | 96,890,744 | Form |
| 9 | Farrell, Michael J | Chairman and CEO | Direct | Sell | 4092026 | 225.50 | 4,991 | 1,125,486 | 105,134,778 | Form |
| 10 | Farrell, Peter C | Direct | Sell | 4022026 | 225.00 | 2,000 | 450,000 | 13,673,925 | Form | |
| 11 | Farrell, Michael J | Chairman and CEO | Direct | Sell | 3102026 | 251.03 | 4,991 | 1,252,902 | 117,036,985 | Form |
| 12 | Farrell, Peter C | Direct | Sell | 3052026 | 260.22 | 2,000 | 520,440 | 16,334,790 | Form | |
| 13 | Sandercock, Brett | Chief Financial Officer | Direct | Sell | 3032026 | 254.30 | 1,000 | 254,300 | 21,487,078 | Form |
| 14 | Farrell, Michael J | Chairman and CEO | Direct | Sell | 2102026 | 273.78 | 4,991 | 1,366,436 | 127,642,580 | Form |
| 15 | Farrell, Peter C | Direct | Sell | 2052026 | 251.31 | 2,000 | 502,620 | 16,278,103 | Form | |
| 16 | Rider, Michael J | Global General Counsel | Direct | Sell | 2052026 | 260.00 | 50 | 13,000 | 2,519,660 | Form |
| 17 | Sandercock, Brett | Chief Financial Officer | Direct | Sell | 2032026 | 257.03 | 1,000 | 257,030 | 21,974,780 | Form |
| 18 | Sandercock, Brett | Chief Financial Officer | Direct | Sell | 1052026 | 241.75 | 1,000 | 241,750 | 20,910,166 | Form |
| 19 | Rider, Michael J | Global General Counsel | Direct | Sell | 1052026 | 241.75 | 50 | 12,088 | 2,354,887 | Form |
| 20 | Farrell, Michael J | Chairman and CEO | Direct | Sell | 12092025 | 251.41 | 4,991 | 1,254,796 | 117,213,917 | Form |
| 21 | Farrell, Peter C | Direct | Sell | 12042025 | 251.47 | 2,000 | 502,940 | 17,294,346 | Form | |
| 22 | Rider, Michael J | Global General Counsel | Direct | Sell | 12022025 | 244.16 | 50 | 12,208 | 2,390,571 | Form |
| 23 | Sandercock, Brett | Chief Financial Officer | Direct | Sell | 12022025 | 244.16 | 1,000 | 244,160 | 21,362,779 | Form |
| 24 | De, Witte Jan | Direct | Sell | 11262025 | 255.00 | 2,055 | 524,025 | 1,086,555 | Form | |
| 25 | Farrell, Peter C | Direct | Sell | 11132025 | 252.05 | 2,000 | 504,100 | 16,663,026 | Form | |
| 26 | De, Witte Jan | Direct | Sell | 11132025 | 250.25 | 487 | 121,872 | 1,331,080 | Form | |
| 27 | Farrell, Michael J | Chairman and CEO | Direct | Sell | 11102025 | 249.75 | 8,011 | 2,000,773 | 116,851,031 | Form |
| 28 | Sandercock, Brett | Chief Financial Officer | Direct | Sell | 11042025 | 247.54 | 3,000 | 742,620 | 21,225,317 | Form |
| 29 | Farrell, Michael J | Chief Executive Officer | Direct | Sell | 10092025 | 282.85 | 8,009 | 2,265,332 | 132,314,172 | Form |
| 30 | Sandercock, Brett | Chief Financial Officer | Direct | Sell | 10022025 | 274.36 | 3,000 | 823,080 | 23,799,358 | Form |
| 31 | Rider, Michael J | Global General Counsel | Direct | Sell | 10022025 | 274.36 | 100 | 27,436 | 3,107,676 | Form |
Investor Activity (13F)
Updated Oct 23, 2026Active managers (13F portfolio over $250M, at least 3 holdings) with a position over $5M that is either over 10% of their portfolio or held in a concentrated book of 50 or fewer total positions. Index/ETF, sovereign, bank, community-bank and charitable/donor-advised filers are excluded.
| Active Manager |
|---|
RMD Trade Sentinel
Constructive
CONVICTION RATIONALE
ResMed's core business is strong, with re-accelerating device sales and double-digit mask growth. The market has punished the stock for a weaker fiscal 2027 outlook, creating an opportunity if the company meets its new, lowered targets. The investment hinges on management executing against this reset of expectations, supported by a dominant market position and powerful demand tailwinds.
STOCK ARCHETYPE
Durable Medical Goods with a recurring 'razorblade' and SaaS component.(New Patient Starts x Device ASP) + (Installed Base x Resupply Rate x Mask/Accessory ASP) + (SaaS Customers x Subscription Price) Gross margin expansion driven by supply chain efficiencies and manufacturing scale, combined with operating leverage as high-margin recurring resupply and software revenue grows.
INVESTMENT THESIS
Evidence suggests underlying business strength is being masked by a conservative forecast that has de-risked expectations.
- Sleep device revenue re-accelerated in Q4, growing 8% in Americas and 13% in Rest of World.
- High-margin mask revenue grew 10% in Americas and 12% in Rest of World in Q4.
- The installed base of over 35 million connected devices provides a recurring revenue foundation.
- Management sees GLP-1 drugs as a 'tailwind,' with data showing higher therapy adoption.
- The company is accelerating share repurchases in fiscal 2027.
PRIMARY RISK
The forecast for 5-7% core growth is not a conservative reset but the start of a structural deceleration as the market matures and GLP-1s begin to shrink the long-term patient population.
- FY27 core revenue growth guidance of 5-7% is a slowdown from 9.9% TTM growth.
- The company guided for a slight gross margin contraction in Q1 FY27.
- Operating expenses grew 12.7% year-over-year, outpacing 9.9% revenue growth.
- Company filings acknowledge GLP-1s could 'reduce the severity or existence of OSA.'
- The stock's two-day reaction to the guidance was -5.0%.
| KPI | Status | Rationale |
|---|---|---|
| Global Sleep Device Revenue Growth | In Q4 FY2026, Sleep Device revenue grew 8% in the Americas and 13% in the Rest of World on a constant currency basis. - Turning around | After a slowdown in Q3, growth in the core device business appears to be re-accelerating. Management attributes this to the global rollout of the AirSense 11 platform, including a recent launch in China, and growing patient awareness. |
| Global Masks & Other Revenue Growth | In Q4 FY2026, Masks & Other revenue grew 10% in the Americas and 12% in the Rest of World on a constant currency basis. - Stable | Growth in this high-margin, recurring-revenue category remains robust and stable. Management highlights innovation in new 'fabric technology' masks and tailwinds from GLP-1 drug users, who show higher therapy adherence and resupply rates. |
| Cloud-connected devices | More than 35 million (As of August 2026) | Indicates the scale of ResMed's digital health ecosystem and the installed base for recurring mask and accessory sales, as well as data-driven insights. |
| myAir registered patients | Over 12 million (As of August 2026) | Represents the number of patients actively engaged with the company's patient-facing digital platform, which is a key driver of therapy adherence and long-term value. |
| Clinician Education Course Completions | More than 5,000 times by 55,000 unique clinicians (As of August 2026) | Measures the reach of the company's efforts to educate physicians, particularly in primary care, to expand the top of the patient diagnostic funnel. |
GLP-1 tailwind vs. guidance headwind
BULL VIEW
Bulls believe the 'once-in-a-generation' demand from GLP-1s and wearables is expanding the market faster than guidance reflects, making the 5-7% growth forecast for FY27 easily achievable.
CORE TENSION
Can the unquantified patient funnel expansion from GLP-1s overcome the quantified 130 basis headwind from the Astral sales suspension and other decelerating factors in the 5% to 7% 2027 guidance?
PREVAILING SENTIMENT
The latest evidence favors the bulls. Management's data shows patients on GLP-1s are eleven percent more likely to start therapy, and core product-line growth is re-accelerating, suggesting underlying strength.
BEAR VIEW
Bears argue the 5-7% guidance is a clear signal of a structural slowdown, and the GLP-1 narrative is masking the long-term risk that these drugs will ultimately shrink the addressable market.
| Timeline | Event & Metric To Watch |
|---|---|
on or around September 1, 2026 | MatrixCare Divestiture Close Watch: The divestiture of the MatrixCare business is expected to close. |
on September 24, 2026 | Quarterly Dividend Payment Watch: A quarterly cash dividend of $0.66 per share will be paid. |
10/28/2026 | Guidance Confirmation or Cut Watch: Q1 results versus lowered expectations and any revision to the full-year FY27 guidance provided in August. |
10/28/2026 | Portfolio Reshuffling Disruption Watch: Commentary on stranded costs, integration progress, and growth rates of the remaining Brightree and MEDIFOX DAN software businesses. |
10/28/2026 | Q1 Fiscal 2027 Earnings Watch: The next quarterly earnings report is scheduled for release. |
11/2/2026 | Peer Read-Through on Demand Watch: INSP's reported revenue growth and management commentary on OSA market trends, patient funnel, and reimbursement dynamics. |
11/16/2026 | Peer Medtronic Earnings Watch: Peer Medtronic (MDT) is scheduled to report earnings. |
No set date | Geopolitical Supply Shock Watch: News on China's export controls for rare earth materials or magnets, or company commentary on component shortages/costs. |
| Date | Event | Stock Impact |
|---|---|---|
2026-08-06 | Q4 Earnings and Weak Guidance Details: The company reported Q4 revenue growth and non-GAAP EPS growth of 16%, but provided a weak 2027 revenue forecast, causing shares to drop. | -5.4% $224.03 -> $211.94 |
2026-07-07 | MatrixCare Business Divestiture Details: The company announced a definitive agreement to sell its MatrixCare software business to Frazier Healthcare Partners for $490 million in cash. | -5.8% $218.40 -> $205.84 |
2026-06-01 | Noctrix Health Acquisition Completed Details: The company completed its acquisition of Noctrix Health, adding a nonpharmacologic treatment for Restless Legs Syndrome to its portfolio. | -4.1% $190.57 -> $182.82 |
2026-04-30 | Q3 Earnings and CFO Change Details: The company reported Q3 FY26 revenue growth of 11% and announced the retirement of its CFO, with Aaron Bloomer appointed as successor. The stock reacted negatively by -3.0%. | -3.3% $211.30 -> $204.41 |
2026-02-24 | New Indiana Distribution Center Details: The company announced it is opening a new distribution center in Greenwood, Indiana, scheduled to begin operations in 2027. | -3.2% $260.02 -> $251.78 |
Position Sizing
4% - 6%
NORMAL POSITION
Sizing is volatility-based: RMD trades at roughly 29% annualized options-implied volatility versus about 13% for the S&P 500 (2.3x the market), around the 60th percentile of its own trailing year. A 4% - 6% position keeps a single-name swing of that size within a diversified portfolio's risk budget.
Diversification Alternatives
MDT - a business partner
Diversified Med-Tech LeaderOffers exposure to a much broader set of medical technologies beyond respiratory care, providing diversification. Its gross margin of 65% is higher than ResMed's.
INSP - a business partner
Disruptive OSA TreatmentProvides exposure to a different OSA treatment modality via nerve stimulation devices, which competes with traditional CPAP therapy for a subset of patients.
A durable medical device franchise transforming into a digital health platform, capitalizing on rising sleep health awareness to drive a high-margin, recurring resupply business.
ResMed dominates the treatment of sleep apnea with its connected devices and masks. Its primary moat is a vast digital ecosystem that locks in providers and patients, driving high-margin, recurring revenue from mask resupply. The company is benefiting from powerful external tailwinds as GLP-1 drugs and consumer wearables are making millions of people aware of sleep disorders, expanding the patient funnel. Management is actively refining its portfolio, divesting slower software assets to double down on its core sleep/respiratory business and adjacent high-growth opportunities.
Data showing an acceleration in new patient diagnoses, continued market share gains in masks, or evidence that its digital ecosystem is successfully increasing long-term patient adherence.
Evidence that GLP-1s are durably reducing sleep apnea severity to a degree that eliminates the need for CPAP therapy, or significant reimbursement cuts for devices and supplies.
Quarter-to-quarter lumpiness in device sales or short-term supply chain component costs.
Repricing Catalyst
The company's fiscal year 2027 guidance, which press reports in August 2026 characterized as weak, causing a significant drop in the stock price. This has reset market expectations and focuses attention on the company's ability to execute against its new forecast and capital return program.
Sleep and Breathing Health
$5.0B TTM (88% of Total) · 44% MarginWhat It Is
This segment sells cloud-connected devices (CPAP, APAP, bilevel, ventilators), masks, and other accessories to HME providers, sleep clinics, and hospitals. Products are used to treat sleep apnea, COPD, and other chronic respiratory diseases in home and hospital settings.
Who Pays & How
HME providers and distributors purchase the equipment and are subsequently reimbursed by government health programs (e.g., Medicare) and private insurers. They choose ResMed for its product innovation, quality, and its connected digital health ecosystem (AirView, myAir) which improves patient adherence and provider efficiency.
Competition
Residential Care Software
$676M TTM (12% of Total) · 32% MarginWhat It Is
This segment provides cloud-based software solutions (SaaS) to healthcare providers in out-of-hospital settings. This includes HME providers (Brightree), home health and hospice agencies, and residential care providers in Germany (MEDIFOX DAN). The recently divested MatrixCare business served skilled nursing and senior living facilities.
Who Pays & How
Residential care providers pay directly for the software via subscriptions. They use these solutions to automate clinical workflows, manage billing and compliance, improve operational efficiency, and drive patient engagement in complex and fragmented care settings.
Competition
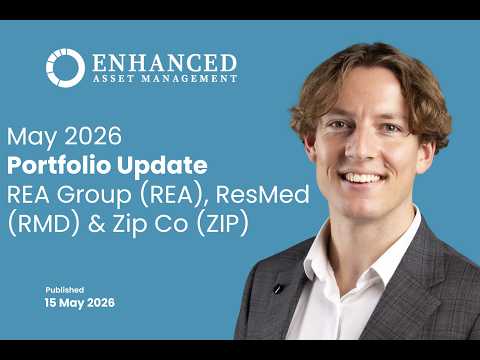
ResMed — Investor Video Playlist






External Quote Links
| Y Finance | Barrons |
| TradingView | Morningstar |
| SeekingAlpha | ValueLine |
| Motley Fool | Robinhood |
| CNBC | Etrade |
| MarketWatch | Unusual Whales |
| YCharts | Perplexity Finance |
| FinViz |
Prefer one of these to Trefis? Tell us why.