
Almonty Industries (ALM)
Market Price (8/25/2026): $18.28 | Market Cap: $5.2 BilSector: Materials | Industry: Diversified Metals & Mining
Almonty Industries (ALM)
Market Price (8/25/2026): $18.28Market Cap: $5.2 BilSector: MaterialsIndustry: Diversified Metals & Mining
Investment Highlights Why It Matters Detailed financial logic regarding cash flow yields vs trend-riding momentum.
Strong revenue growthRev Chg LTMRevenue Change % Last Twelve Months (LTM) is 205% Attractive cash flow generationCFO/Rev LTMCash Flow from Operations / Revenue (Sales), Last Twelve Months (LTM) is 32% Megatrend and thematic driversMegatrends include Critical Minerals & Strategic Resources. Themes include Tungsten Mining & Supply, Industrial Hard Materials, and High-Performance Alloys. | Expensive valuation multiplesP/SPrice/Sales ratio is 61x, P/EBITPrice/EBIT or Price/(Operating Income) ratio is 42x, P/CFOPrice/(Cash Flow from Operations). CFO is cash before capital expenditures. is 190x, P/EPrice/Earnings or Price/(Net Income) is 48x Stock price has recently run up significantly12M Rtn12 month market price return is 327% Not cash flow generativeFCF/Rev LTMFree Cash Flow / Revenue (Sales), Last Twelve Months (LTM) is -65% Yield minus risk free rate is negativeERPEquity Risk Premium (ERP) = Total Yield - Risk Free Rate, Reflects the premium above risk free assets offered by the investment. is -2.4% Key risksALM key risks include [1] a history of significant unprofitability and negative margins and [2] geopolitical and supply chain vulnerabilities in the specific jurisdictions where it operates. |
| Strong revenue growthRev Chg LTMRevenue Change % Last Twelve Months (LTM) is 205% |
| Attractive cash flow generationCFO/Rev LTMCash Flow from Operations / Revenue (Sales), Last Twelve Months (LTM) is 32% |
| Megatrend and thematic driversMegatrends include Critical Minerals & Strategic Resources. Themes include Tungsten Mining & Supply, Industrial Hard Materials, and High-Performance Alloys. |
| Expensive valuation multiplesP/SPrice/Sales ratio is 61x, P/EBITPrice/EBIT or Price/(Operating Income) ratio is 42x, P/CFOPrice/(Cash Flow from Operations). CFO is cash before capital expenditures. is 190x, P/EPrice/Earnings or Price/(Net Income) is 48x |
| Stock price has recently run up significantly12M Rtn12 month market price return is 327% |
| Not cash flow generativeFCF/Rev LTMFree Cash Flow / Revenue (Sales), Last Twelve Months (LTM) is -65% |
| Yield minus risk free rate is negativeERPEquity Risk Premium (ERP) = Total Yield - Risk Free Rate, Reflects the premium above risk free assets offered by the investment. is -2.4% |
| Key risksALM key risks include [1] a history of significant unprofitability and negative margins and [2] geopolitical and supply chain vulnerabilities in the specific jurisdictions where it operates. |
Qualitative Assessment
AI Analysis | Feedback
Almonty Industries (ALM) stock has lost about 15% since 4/30/2026 because of the following key factors:
1. Decline in Tungsten Prices During Q3 Fiscal 2026. While Almonty Industries reported robust financial results for fiscal Q2 2026 (ended June 30, 2026) driven by record tungsten prices, the underlying commodity market experienced a notable downturn in the subsequent period. Chinese Ammonium Paratungstate (APT) prices saw a significant 15.0% decline in July 2026, attributed to weak downstream demand and lower feedstock costs. A broader "downward trend" in tungsten prices was observed starting in June 2026, influencing global markets and impacting investor sentiment for tungsten producers like Almonty.
2. Analyst Downgrades and Revised Earnings Estimates. Despite Almonty's strong performance in fiscal Q2 2026, which included a 498% year-over-year revenue increase to $43.0 million, analyst firm Diamond Equity Research revised its full-year fiscal 2026 earnings per share (EPS) estimate downward from $0.55 to $0.39 on August 14, 2026. The firm also lowered its fiscal 2027 EPS forecast from $1.23 to $1.04. These downgrades, occurring shortly after the release of strong Q2 results, signal concerns among analysts regarding the company's future earnings trajectory, potentially reflecting a cautious outlook on sustained tungsten prices or the pace of its flagship mine's ramp-up.
Show more
Almonty Industries (ALM) stock has lost about 15% since 4/30/2026 because of the following key factors:
1. Decline in Tungsten Prices During Q3 Fiscal 2026. While Almonty Industries reported robust financial results for fiscal Q2 2026 (ended June 30, 2026) driven by record tungsten prices, the underlying commodity market experienced a notable downturn in the subsequent period. Chinese Ammonium Paratungstate (APT) prices saw a significant 15.0% decline in July 2026, attributed to weak downstream demand and lower feedstock costs. A broader "downward trend" in tungsten prices was observed starting in June 2026, influencing global markets and impacting investor sentiment for tungsten producers like Almonty.
2. Analyst Downgrades and Revised Earnings Estimates. Despite Almonty's strong performance in fiscal Q2 2026, which included a 498% year-over-year revenue increase to $43.0 million, analyst firm Diamond Equity Research revised its full-year fiscal 2026 earnings per share (EPS) estimate downward from $0.55 to $0.39 on August 14, 2026. The firm also lowered its fiscal 2027 EPS forecast from $1.23 to $1.04. These downgrades, occurring shortly after the release of strong Q2 results, signal concerns among analysts regarding the company's future earnings trajectory, potentially reflecting a cautious outlook on sustained tungsten prices or the pace of its flagship mine's ramp-up.
3. Minimal Revenue Contribution and Perceived Execution Risk from Sangdong Mine. Almonty's flagship Sangdong mine in South Korea, currently in Phase I commissioning, contributed minimally to the company's fiscal Q2 2026 revenue, generating approximately C$0.06 million. The strong Q2 results were primarily driven by the Panasqueira operation. Given that Almonty's valuation hinges on "flawless Sangdong execution and sustained tungsten prices," any perceived delays in its ramp-up or concerns about its future output amid fluctuating tungsten prices can "rapidly erode perceived earnings power," leading to investor caution and contributing to the stock's decline.
Show less
Stock Movement Drivers
Fundamental Drivers
The -15.7% change in ALM stock from 4/30/2026 to 8/24/2026 was primarily driven by a -62.0% change in the company's P/S Multiple.| (LTM values as of) | 4302026 | 8242026 | Change |
|---|---|---|---|
| Stock Price ($) | 21.68 | 18.28 | -15.7% |
| Change Contribution By: | |||
| Total Revenues ($ Mil) | 33 | 86 | 163.9% |
| P/S Multiple | 159.7 | 60.7 | -62.0% |
| Shares Outstanding (Mil) | 240 | 285 | -16.0% |
| Cumulative Contribution | -15.7% |
Market Drivers
4/30/2026 to 8/24/2026| Return | Correlation | |
|---|---|---|
| ALM | -15.7% | |
| Market (SPY) | 6.2% | 46.3% |
| Sector (XLB) | 4.1% | 39.9% |
Fundamental Drivers
The 61.9% change in ALM stock from 1/31/2026 to 8/24/2026 was primarily driven by a 185.3% change in the company's Total Revenues ($ Mil).| (LTM values as of) | 1312026 | 8242026 | Change |
|---|---|---|---|
| Stock Price ($) | 11.29 | 18.28 | 61.9% |
| Change Contribution By: | |||
| Total Revenues ($ Mil) | 30 | 86 | 185.3% |
| P/S Multiple | 81.0 | 60.7 | -25.1% |
| Shares Outstanding (Mil) | 216 | 285 | -24.2% |
| Cumulative Contribution | 61.9% |
Market Drivers
1/31/2026 to 8/24/2026| Return | Correlation | |
|---|---|---|
| ALM | 61.9% | |
| Market (SPY) | 10.6% | 47.7% |
| Sector (XLB) | 9.2% | 44.1% |
Fundamental Drivers
The 395.4% change in ALM stock from 7/31/2025 to 8/24/2026 was primarily driven by a 196.7% change in the company's Total Revenues ($ Mil).| (LTM values as of) | 7312025 | 8242026 | Change |
|---|---|---|---|
| Stock Price ($) | 3.69 | 18.28 | 395.4% |
| Change Contribution By: | |||
| Total Revenues ($ Mil) | 29 | 86 | 196.7% |
| P/S Multiple | 35.3 | 60.7 | 72.2% |
| Shares Outstanding (Mil) | 276 | 285 | -3.0% |
| Cumulative Contribution | 395.4% |
Market Drivers
7/31/2025 to 8/24/2026| Return | Correlation | |
|---|---|---|
| ALM | 395.4% | |
| Market (SPY) | 21.8% | 38.8% |
| Sector (XLB) | 23.9% | 35.7% |
Fundamental Drivers
nullnull
Market Drivers
7/31/2023 to 8/24/2026| Return | Correlation | |
|---|---|---|
| ALM | ||
| Market (SPY) | 72.7% | 37.1% |
| Sector (XLB) | 31.9% | 33.3% |
Price Returns Compared
| 2021 | 2022 | 2023 | 2024 | 2025 | 2026 | Total [1] | |
|---|---|---|---|---|---|---|---|
| Returns | |||||||
| ALM Return | - | - | - | - | 85% | 110% | 288% |
| Peers Return | 24% | 30% | 45% | 32% | 62% | 57% | 682% |
| S&P 500 Return | 27% | -19% | 24% | 23% | 16% | 12% | 104% |
Monthly Win Rates [3] | |||||||
| ALM Win Rate | - | - | - | - | 67% | 50% | |
| Peers Win Rate | 53% | 57% | 55% | 47% | 67% | 65% | |
| S&P 500 Win Rate | 75% | 42% | 67% | 75% | 67% | 50% | |
Max Drawdowns [4] | |||||||
| ALM Max Drawdown | - | - | - | - | - | -53% | |
| Peers Max Drawdown | -35% | -42% | -26% | -25% | -31% | -24% | |
| S&P 500 Max Drawdown | -5% | -25% | -10% | -8% | -19% | -9% | |
[1] Cumulative total returns since the beginning of 2021
[2] Peers: ATI, CRS, FCX, TECK, SCCO.
[3] Win Rate = % of calendar months in which monthly returns were positive
[4] Max drawdown represents maximum peak-to-trough decline within a year
[5] 2026 data is for the year up to 8/24/2026 (YTD)
How Low Can It Go
ALM has limited trading history. Below is the Materials sector ETF (XLB) in its place.
| Event | XLB | S&P 500 |
|---|---|---|
| 2025 US Tariff Shock | ||
| % Loss | -17.0% | -18.8% |
| % Gain to Breakeven | 20.5% | 23.1% |
| Time to Breakeven | 84 days | 79 days |
| Summer-Fall 2023 Five Percent Yield Shock | ||
| % Loss | -12.5% | -9.5% |
| % Gain to Breakeven | 14.3% | 10.5% |
| Time to Breakeven | 52 days | 24 days |
| 2022 Inflation Shock & Fed Tightening | ||
| % Loss | -23.5% | -24.5% |
| % Gain to Breakeven | 30.7% | 32.4% |
| Time to Breakeven | 456 days | 427 days |
| 2020 COVID-19 Crash | ||
| % Loss | -36.2% | -33.7% |
| % Gain to Breakeven | 56.8% | 50.9% |
| Time to Breakeven | 114 days | 140 days |
| Q4 2018 Fed Policy Error / Growth Scare | ||
| % Loss | -18.3% | -19.2% |
| % Gain to Breakeven | 22.4% | 23.8% |
| Time to Breakeven | 101 days | 105 days |
| 2015-2016 China Devaluation / Global Growth Scare | ||
| % Loss | -17.9% | -12.2% |
| % Gain to Breakeven | 21.7% | 13.9% |
| Time to Breakeven | 52 days | 62 days |
In The Past
State Street Materials Select Sector SPDR ETF's stock fell -17.0% during the 2025 US Tariff Shock. Such a loss loss requires a 20.5% gain to breakeven.
Preserve Wealth
Limiting losses and compounding gains is essential to preserving wealth.
Asset Allocation
Actively managed asset allocation strategies protect wealth. Learn more.
ALM has limited trading history. Below is the Materials sector ETF (XLB) in its place.
| Event | XLB | S&P 500 |
|---|---|---|
| 2022 Inflation Shock & Fed Tightening | ||
| % Loss | -23.5% | -24.5% |
| % Gain to Breakeven | 30.7% | 32.4% |
| Time to Breakeven | 456 days | 427 days |
| 2020 COVID-19 Crash | ||
| % Loss | -36.2% | -33.7% |
| % Gain to Breakeven | 56.8% | 50.9% |
| Time to Breakeven | 114 days | 140 days |
| 2014-2016 Oil Price Collapse | ||
| % Loss | -23.8% | -6.8% |
| % Gain to Breakeven | 31.2% | 7.3% |
| Time to Breakeven | 171 days | 15 days |
| 2011 US Debt Ceiling Crisis & European Contagion | ||
| % Loss | -28.2% | -17.9% |
| % Gain to Breakeven | 39.3% | 21.8% |
| Time to Breakeven | 459 days | 123 days |
| 2008-2009 Global Financial Crisis | ||
| % Loss | -56.6% | -53.4% |
| % Gain to Breakeven | 130.3% | 114.4% |
| Time to Breakeven | 701 days | 1085 days |
In The Past
State Street Materials Select Sector SPDR ETF's stock fell -17.0% during the 2025 US Tariff Shock. Such a loss loss requires a 20.5% gain to breakeven.
Preserve Wealth
Limiting losses and compounding gains is essential to preserving wealth.
Asset Allocation
Actively managed asset allocation strategies protect wealth. Learn more.
About Almonty Industries (ALM)
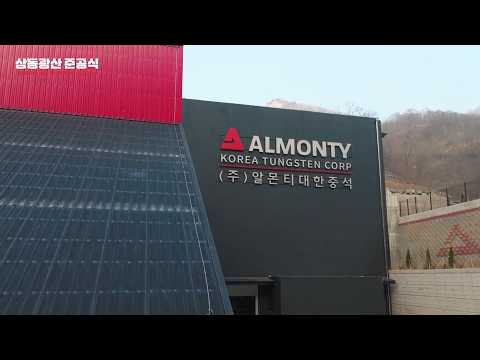
Almonty Industries (ALM) is a leading global company specializing in the mining, exploration, and development of tungsten properties. The company's primary business involves extracting tungsten, a critical industrial metal, and producing high-quality tungsten concentrates. Tungsten is highly valued for its exceptional hardness, high melting point, and density, making it an indispensable component in various advanced manufacturing processes.
The tungsten concentrate produced by Almonty serves a wide array of vital industries globally. Its applications include the manufacturing of hard-metal cutting tools, drill bits for mining and construction, components for aerospace and defense, and materials for electronics and lighting. Almonty aims to be a significant and reliable non-Chinese supplier of tungsten to these industrial markets, leveraging its strategically located assets which include operational and development projects in Portugal (Panasqueira mine), Spain (Barruecopardo mine), and South Korea (Sangdong mine).
AI Analysis | Feedback
1. It's like a focused version of a major mining company such as Rio Tinto, but specializing in tungsten.
2. Think of it as the 'Barrick Gold' of tungsten mining – a specialist in a critical industrial metal.
AI Analysis | Feedback
- Tungsten Concentrate: A processed ore containing a high concentration of tungsten, which is a critical metal used in various industrial applications like cutting tools, aerospace, and electronics.
AI Analysis | Feedback
Almonty Industries (ALM) is a tungsten mining company that extracts and processes tungsten concentrate. It sells this raw material primarily to other companies (B2B) for various industrial applications.
Due to the nature of commodity markets and competitive considerations, Almonty Industries does not publicly disclose the specific names of its major customer companies. However, its customers are industrial consumers and manufacturers across various sectors globally that require tungsten for their production processes. These include, but are not limited to, companies involved in:
- Manufacturing of hard metals and cutting tools (e.g., cemented carbides, industrial drills, wear-resistant components).
- Production for the aerospace, defense, and automotive industries, where tungsten is valued for its strength, density, and high-temperature resistance.
- Electronics, lighting, and chemical industries, utilizing tungsten in filaments, electrical contacts, and various chemical compounds.
AI Analysis | Feedback
- DL E&C Co., Ltd. (KRX: 375500)
- Korea Electric Power Corporation (KEPCO) (KRX: 015760)
AI Analysis | Feedback
Lewis Black, Chairman of the Board, President and Chief Executive Officer
Mr. Black founded Almonty Industries in 2011. He previously served as Chairman and Chief Executive Officer of Primary Metals Inc. ("PMI"), a former TSX-V listed tungsten mining company, from June 2005 to December 2007. PMI was subsequently acquired by Sojitz Corporation in 2008. Prior to founding Almonty, Mr. Black was the head of sales and marketing for SC Mining Tungsten in Thailand. He holds a Bachelor of Arts degree in management and technology from Manchester University.
Brian Fox, Chief Financial Officer
Mr. Fox was appointed Chief Financial Officer, effective August 25, 2025, succeeding Mark Gelmon. He brings over 25 years of operational leadership experience, most recently serving as Chief Financial & Operating Officer at CBIZ Marks Paneth, a U.S. accounting and advisory firm. His prior experience includes leadership roles at Loureiro Engineering and United Subcontractors, as well as senior audit work at Arthur Andersen. Mr. Fox holds a Master's degree in Management from Harvard University and a Bachelor of Science in Accounting from the University of Connecticut.
Brigadier General (Retired) Steven L. Allen, Chief Operating Officer
General Allen was appointed Chief Operating Officer effective December 1, 2025. He brings over 33 years of distinguished U.S. military experience, having most recently served as Commanding General of the 19th Expeditionary Sustainment Command, Director of Logistics for U.S. Forces Korea, Combined Forces Command and United Nations Command, and Commandant of the U.S. Army Ordnance School. General Allen holds a Master of Strategic Studies from the U.S. Army War College, a Master of Business Administration from the Florida Institute of Technology, a Master of Science in Administration from Central Michigan University, and a Bachelor of Science in Industrial Technology from the University of North Dakota.
Guillaume Wiesenbach de Lamaziere, Chief Development Officer
Mr. Wiesenbach de Lamaziere was appointed Chief Development Officer on January 6, 2026. He is a seasoned financial and capital markets executive with over 30 years of experience, including leading complex, large-scale, cross-border projects in banking and asset management. He served as CEO and COO/CFO of AIG Asset Management Europe Ltd. in London and as CEO and COO/CFO of Banque AIG in Paris. His career also includes financial management roles at Natixis Capital Markets, Goldman Sachs, and Arthur Andersen. He holds an MBA from Texas A&M University and a Finance degree from Burgundy School of Business, France, and is a Chartered Financial Analyst.
AI Analysis | Feedback
The key risks to Almonty Industries (ALM) primarily revolve around the inherent challenges of the mining industry, commodity price exposure, and financial health, particularly given its focus on tungsten extraction and development projects like the Sangdong Mine.
- Market Volatility and Tungsten Price Fluctuations: Almonty Industries' profitability is directly tied to the volatile market price of tungsten, which is derived from ammonium para tungstate (APT) prices. Significant fluctuations in these prices could adversely impact the company's revenues and earnings, despite having a "Floor Price" safety net for a portion of its sales.
- Operational and Execution Risks: The company faces substantial operational risks associated with mining, processing, and shipping tungsten concentrate from its various projects. These include potential delays in stabilizing and ramping up production at key mines, such as the Sangdong processing plant, as well as permitting hurdles and other technical and safety challenges inherent in large-scale mining operations.
- Financial Challenges and Funding Requirements: Almonty Industries has experienced financial difficulties, evidenced by negative operating and net margins, and has accumulated significant debt. The company's ability to fund its ongoing commitments and further expansion, particularly for large development projects, depends on securing adequate financing, which could also lead to shareholder dilution, as has occurred in the past.
AI Analysis | Feedback
AI Analysis | Feedback
Almonty Industries (symbol: ALM) primarily focuses on the mining, processing, and shipping of tungsten concentrate, with molybdenum concentrate as a significant byproduct in some of its operations.
The addressable markets for their main products are as follows:
- Tungsten: The global tungsten market was valued at approximately USD 7.3 billion in 2025 and is projected to expand to USD 7.6 billion in 2026.
- Molybdenum: The global molybdenum market size is estimated to be valued at approximately USD 4.82 billion in 2025.
AI Analysis | Feedback
Expected Drivers of Future Revenue Growth for Almonty Industries (ALM)
Over the next 2-3 years, Almonty Industries (ALM) is expected to experience revenue growth driven by several key factors:
- Commercial Production from the Sangdong Mine: Almonty Industries is transitioning its Sangdong Mine from development to full commercial production, with construction substantially complete and ramp-up activities underway. This move is expected to position Sangdong as the largest tungsten mine in the Western world, significantly increasing the company's output of tungsten concentrate.
- Favorable Tungsten Prices Driven by Supply-Demand Imbalance: The company is poised to benefit from a significant uptick in tungsten prices, which have seen substantial increases year-to-date. This surge is attributed to a global supply crisis and strong demand, particularly in key sectors such as defense and advanced technology, and exacerbated by Chinese export restrictions. Analysts have materially raised price assumptions for tungsten through approximately 2028.
- Increased Production and Higher-Grade Resources from Panasqueira Mine: Almonty's ongoing initiatives at its Panasqueira Mine, including an extensive drilling program aimed at accessing higher-grade resources, are expected to enhance its growth prospects and operational longevity. This focus on improved resource quality and extraction can lead to increased sales volume and potentially higher-value products.
- New Production from the U.S. Tungsten Project: Almonty acquired a strategic U.S. tungsten project in Beaverhead County, Montana, which is anticipated to begin near-term production as early as the second half of 2026. This new operational asset will contribute to the company's overall tungsten output and diversify its production base.
AI Analysis | Feedback
Share Issuance
- Almonty successfully listed on the Nasdaq Capital Market in July 2025, concurrently completing an upsized public offering of common shares in the United States for gross proceeds of US$90 million.
- The number of outstanding shares increased from 120.1 million as of December 31, 2024, to 185.6 million as of September 30, 2025.
- The number of shares outstanding increased by 16.04% in one year as of July 7, 2025.
Inbound Investments
- The company's cash and cash equivalents significantly increased to $111.6 million as of September 30, 2025, from $7.8 million as of December 31, 2024, primarily due to the US$90 million public offering.
- Institutional investors hold a total of 56,964,221 shares, with major shareholders including Van Eck Associates Corp and Fmr Llc.
- First Eagle Investment Management initiated a 90,000-share stake in Almonty Industries in Q3 2025.
Capital Expenditures
- Capital expenditures for the third quarter of 2025 were 25.6 million CAD.
- In the 12 months leading up to July 7, 2025, capital expenditures totaled -$45.80 million.
- Significant capital has been allocated to the Sangdong mine in South Korea, where construction is substantially complete, and the company is transitioning from development to production to establish it as a major tungsten mine.
Peer Outperformance in Diversified Metals & Mining
null| Industry | Names | 1Y med | 3Y med | 5Y med | Top 3 by 5Y |
|---|---|---|---|---|---|
| Copper | 7 | 117.5% | 98.6% | 323.1% | COPR 1217% · TGB 443% · HBM 404% |
| Silver | 6 | 167.8% | 310.3% | 181.2% | HL 261% · AYA 239% · SVM 214% |
| Gold | 32 | 61.5% | 223.0% | 172.0% | IAG 836% · CNL 570% · OGC 523% |
| Steel | 13 | 22.3% | 49.8% | 119.7% | AMR 477% · HCC 463% · NWPX 330% |
| Diversified Metals & Mining ← | 24 | 9.8% | 6.9% | 50.0% | ATLX 239186% · USAR 61276% · FMST 1006% |
| Aluminum | 3 | 96.1% | 134.1% | 49.5% | CENX 276% · KALU 49% · AA 24% |
| Construction Materials | 7 | -14.2% | 31.8% | 45.3% | USLM 317% · CRH 98% · VMC 51% |
| Metal, Glass & Plastic Containers | 11 | 3.7% | 9.8% | 7.3% | KRT 170% · MYE 72% · GEF 61% |
| Paper & Plastic Packaging Products & Materials | 7 | 13.9% | 19.7% | -4.4% | PKG 92% · CCK 14% · SON 7% |
| Precious Metals & Minerals | 9 | 49.7% | 170.5% | -5.3% | ASM 657% · PPTA 382% · ELE 123% |
| Specialty Chemicals | 40 | 9.9% | 1.1% | -12.2% | LWLG 808% · ODC 493% · NEU 201% |
| Commodity Chemicals | 13 | 26.0% | 18.0% | -14.6% | HWKN 238% · MEOH 84% · LXU 62% |
| Diversified Chemicals | 4 | 2.9% | -27.2% | -26.4% | CBT 72% · ASH -6% · CC -47% |
| Fertilizers & Agricultural Chemicals | 10 | -3.9% | 0.5% | -34.9% | CF 214% · CTVA 100% · NTR 46% |
| Paper Products | 3 | -12.3% | -51.9% | -95.7% | CLW -35% · ITP -96% · MERC -96% |
Latest Trefis Analyses
| Title | |
|---|---|
| ARTICLES |
Research & Analysis
Invest in Strategies
Wealth Management
Peer Comparisons
| Peers to compare with: |
Financials
| Median | |
|---|---|
| Name | |
| Mkt Price | 143.81 |
| Mkt Cap | 31.5 |
| Rev LTM | 9,353 |
| Op Inc LTM | 2,210 |
| FCF LTM | 1,144 |
| FCF 3Y Avg | 278 |
| CFO LTM | 2,727 |
| CFO 3Y Avg | 1,743 |
Growth & Margins
| Median | |
|---|---|
| Name | |
| Rev Chg LTM | 20.7% |
| Rev Chg 3Y Avg | 8.0% |
| Rev Chg Q | 26.6% |
| QoQ Delta Rev Chg LTM | 5.8% |
| Op Inc Chg LTM | 43.2% |
| Op Inc Chg 3Y Avg | 22.4% |
| Op Mgn LTM | 23.2% |
| Op Mgn 3Y Avg | 15.7% |
| QoQ Delta Op Mgn LTM | 1.7% |
| CFO/Rev LTM | 27.4% |
| CFO/Rev 3Y Avg | 19.8% |
| FCF/Rev LTM | 11.4% |
| FCF/Rev 3Y Avg | 6.3% |
Segment Financials
Revenue by Segment| $ Mil | 2025 | 2024 | 2023 | 2022 | 2021 |
|---|---|---|---|---|---|
| Panasqueira Mine | 32 | 29 | 23 | 25 | 21 |
| Woulfe | 0 | 0 | 0 | 0 | 0 |
| Corporate | 0 | 0 | 0 | 0 | 0 |
| Gentung Tungsten Project | 0 | 0 | |||
| Los Santos Mine | 0 | 0 | 0 | 0 | 0 |
| Valtreixal Mine | 0 | 0 | 0 | 0 | 0 |
| Total | 33 | 29 | 23 | 25 | 21 |
| $ Mil | 2025 | 2024 | 2023 | 2022 | 2021 |
|---|---|---|---|---|---|
| Panasqueira Mine | 4 | 3 | 2 | 4 | 4 |
| Woulfe | 0 | 0 | 0 | -0 | -0 |
| Corporate | 0 | 0 | 0 | 0 | 0 |
| Valtreixal Mine | 0 | 0 | 0 | -0 | -0 |
| Los Santos Mine | -1 | -1 | -1 | -1 | -1 |
| Share-based compensation | -11 | -3 | -1 | -4 | -2 |
| General and administrative | -21 | -6 | -6 | -6 | -6 |
| Total | -29 | -7 | -6 | -7 | -5 |
| $ Mil | 2025 | 2024 | 2023 | 2022 | 2021 |
|---|---|---|---|---|---|
| Corporate | 266 | 5 | 0 | 0 | 1 |
| Woulfe | 228 | 175 | 156 | 109 | 81 |
| Panasqueira Mine | 37 | 35 | 38 | 44 | 49 |
| Los Santos Mine | 35 | 32 | 32 | 32 | 27 |
| Gentung Tungsten Project | 14 | 0 | |||
| Valtreixal Mine | 9 | 9 | 8 | 8 | 8 |
| Total | 590 | 256 | 235 | 193 | 166 |
Price Behavior
| Market Price | $18.28 | |
| Market Cap ($ Bil) | 5.1 | |
| First Trading Date | 05/28/2013 | |
| Distance from 52W High | -21.9% | |
| 50 Days | 200 Days | |
| DMA Price | $11.03 | $4.63 |
| DMA Trend | up | down |
| Distance from DMA | 65.7% | 294.9% |
| 3M | 1YR | |
| Volatility | 100.5% | 94.7% |
| Downside Capture | 364.61 | 254.09 |
| Upside Capture | 320.29 | 375.02 |
| Correlation (SPY) | 50.4% | 38.9% |
| 1M | 2M | 3M | 6M | 1Y | 3Y | |
|---|---|---|---|---|---|---|
| Beta | 3.55 | 3.79 | 3.55 | 3.46 | 2.83 | 0.47 |
| Up Beta | 6.12 | 3.27 | 3.32 | 2.94 | 2.62 | -0.89 |
| Down Beta | 2.08 | 4.09 | 4.39 | 3.45 | 2.35 | -0.03 |
| Up Capture | 5% | 221% | 143% | 629% | 1435% | 109% |
| Bmk +ve Days | 11 | 22 | 35 | 67 | 138 | 427 |
| Stock +ve Days | 8 | 17 | 26 | 60 | 127 | 130 |
| Down Capture | 537% | 394% | 365% | 242% | 170% | 97% |
| Bmk -ve Days | 11 | 21 | 28 | 59 | 114 | 326 |
| Stock -ve Days | 14 | 26 | 37 | 65 | 121 | 130 |
[1] Upside and downside betas calculated using positive and negative benchmark daily returns respectively
Based On 1-Year Data
| Annualized Return | Annualized Volatility | Sharpe Ratio | Correlation with ALM | |
|---|---|---|---|---|
| ALM | 329.6% | 94.3% | 1.97 | - |
| Sector ETF (XLB) | 20.4% | 17.9% | 0.88 | 36.5% |
| Equity (SPY) | 21.2% | 12.9% | 1.23 | 38.6% |
| Gold (GLD) | 39.0% | 28.8% | 1.14 | 45.7% |
| Commodities (DBC) | 40.9% | 20.2% | 1.58 | 5.7% |
| Real Estate (VNQ) | 13.9% | 13.8% | 0.70 | 8.6% |
| Bitcoin (BTCUSD) | -30.4% | 44.2% | -0.69 | 27.0% |
Smart multi-asset allocation framework can stack odds in your favor. Learn How
Based On 5-Year Data
| Annualized Return | Annualized Volatility | Sharpe Ratio | Correlation with ALM | |
|---|---|---|---|---|
| ALM | 30.9% | 93.4% | 1.72 | - |
| Sector ETF (XLB) | 6.5% | 19.1% | 0.23 | 33.3% |
| Equity (SPY) | 12.8% | 17.2% | 0.57 | 37.1% |
| Gold (GLD) | 20.6% | 18.6% | 0.90 | 44.2% |
| Commodities (DBC) | 10.2% | 19.6% | 0.41 | 5.3% |
| Real Estate (VNQ) | 2.4% | 18.9% | 0.02 | 5.9% |
| Bitcoin (BTCUSD) | 11.2% | 52.8% | 0.40 | 26.8% |
Smart multi-asset allocation framework can stack odds in your favor. Learn How
Based On 10-Year Data
| Annualized Return | Annualized Volatility | Sharpe Ratio | Correlation with ALM | |
|---|---|---|---|---|
| ALM | 14.4% | 93.4% | 1.72 | - |
| Sector ETF (XLB) | 10.4% | 20.7% | 0.45 | 33.3% |
| Equity (SPY) | 15.1% | 17.9% | 0.72 | 37.1% |
| Gold (GLD) | 12.9% | 16.3% | 0.65 | 44.2% |
| Commodities (DBC) | 7.8% | 18.1% | 0.35 | 5.3% |
| Real Estate (VNQ) | 5.0% | 20.7% | 0.20 | 5.9% |
| Bitcoin (BTCUSD) | 63.1% | 66.2% | 1.03 | 26.8% |
Smart multi-asset allocation framework can stack odds in your favor. Learn How
Earnings Returns History
Updated 6/2/2026| Forward Returns | |||
|---|---|---|---|
| Earnings Date | 1D Returns | 5D Returns | 21D Returns |
| SUMMARY STATS | |||
| # Positive | 0 | 0 | 0 |
| # Negative | 0 | 0 | 0 |
| Median Positive | |||
| Median Negative | |||
| Max Positive | |||
| Max Negative | |||
| Forward Returns | |||
|---|---|---|---|
| Earnings Date | 1D Returns | 5D Returns | 21D Returns |
| SUMMARY STATS | |||
| # Positive | 0 | 0 | 0 |
| # Negative | 0 | 0 | 0 |
| Median Positive | |||
| Median Negative | |||
| Max Positive | |||
| Max Negative | |||

Industry Resources
| Materials Resources |
| Chemical & Engineering News (C&EN) |
| Mining.com |
| Plastics News |
| Diversified Metals & Mining Resources |
| Mining Technology |
| International Mining |
| Northern Miner |
External Quote Links
| Y Finance | Barrons |
| TradingView | Morningstar |
| SeekingAlpha | ValueLine |
| Motley Fool | Robinhood |
| CNBC | Etrade |
| MarketWatch | Unusual Whales |
| YCharts | Perplexity Finance |
| FinViz |
Prefer one of these to Trefis? Tell us why.