Alamos Gold (AGI)
Market Price (7/2/2026): $30.4 | Market Cap: $12.8 BilSector: Materials | Industry: Gold
Alamos Gold (AGI)
Market Price (7/2/2026): $30.4Market Cap: $12.8 BilSector: MaterialsIndustry: Gold
Investment Highlights Why It Matters Detailed financial logic regarding cash flow yields vs trend-riding momentum.
Attractive yieldTotal YieldTotal Yield = Earnings Yield + Dividend Yield, Earnings Yield = Net Income / Market Cap Dividend Yield = Total Dividends / Market Cap is 8.5%, ERPEquity Risk Premium (ERP) = Total Yield - Risk Free Rate, Reflects the premium above risk free assets offered by the investment. is 4.3% Strong revenue growthRev Chg LTMRevenue Change % Last Twelve Months (LTM) is 48% Attractive operating marginsOp Mgn LTMOperating Margin = Operating Income / Revenue Reflects profitability before taxes and before impact of capital structure (interest payments). is 54% Attractive cash flow generationCFO/Rev LTMCash Flow from Operations / Revenue (Sales), Last Twelve Months (LTM) is 46%, FCF/Rev LTMFree Cash Flow / Revenue (Sales), Last Twelve Months (LTM) is 17% Valuation becoming less expensiveP/S 6M Chg %Price/Sales change over 6 months. Declining P/S indicates valuation has become less expensive. is -32% Megatrend and thematic driversMegatrends include Global Resource Supply & Security. Themes include Precious Metals Extraction, and Sustainable Mining Operations. | Key risksAGI key risks include [1] potential execution delays and cost overruns at its key Island Gold and Magino growth projects, Show more. |
| Attractive yieldTotal YieldTotal Yield = Earnings Yield + Dividend Yield, Earnings Yield = Net Income / Market Cap Dividend Yield = Total Dividends / Market Cap is 8.5%, ERPEquity Risk Premium (ERP) = Total Yield - Risk Free Rate, Reflects the premium above risk free assets offered by the investment. is 4.3% |
| Strong revenue growthRev Chg LTMRevenue Change % Last Twelve Months (LTM) is 48% |
| Attractive operating marginsOp Mgn LTMOperating Margin = Operating Income / Revenue Reflects profitability before taxes and before impact of capital structure (interest payments). is 54% |
| Attractive cash flow generationCFO/Rev LTMCash Flow from Operations / Revenue (Sales), Last Twelve Months (LTM) is 46%, FCF/Rev LTMFree Cash Flow / Revenue (Sales), Last Twelve Months (LTM) is 17% |
| Valuation becoming less expensiveP/S 6M Chg %Price/Sales change over 6 months. Declining P/S indicates valuation has become less expensive. is -32% |
| Megatrend and thematic driversMegatrends include Global Resource Supply & Security. Themes include Precious Metals Extraction, and Sustainable Mining Operations. |
| Key risksAGI key risks include [1] potential execution delays and cost overruns at its key Island Gold and Magino growth projects, Show more. |
Qualitative Assessment
AI Analysis | Feedback
Alamos Gold (AGI) stock has lost about 30% since 3/31/2026 because of the following key factors:
Alamos Gold (AGI) experienced a significant stock decline of approximately 30% since fiscal Q1 2026, driven by a combination of company-specific operational challenges and broader macroeconomic shifts affecting the gold market.
1. Q1 2026 Earnings Miss and Elevated Costs.
Alamos Gold reported Q1 2026 adjusted earnings per share (EPS) of $0.55, falling short of some analyst consensus estimates, notably missing the $0.6059 forecast by 9.23% and the $0.6426 estimate by 14.41%. This earnings miss, coupled with all-in sustaining costs (AISC) of $1,862 per ounce that exceeded first-half guidance due to ongoing inflationary pressures on labor, energy, and consumables, contributed to a post-earnings stock decline of approximately 2.6% in after-hours trading.
2. Q2 2026 Production Cut from Operational Disruptions.
The company announced a significant reduction in its fiscal Q2 2026 production guidance to 130,000–135,000 ounces following seismic events and a power outage at its Young-Davidson mine. This operational setback prompted a revision of the full-year production outlook, which is now expected to be below the previously guided floor of 570,000 ounces. In response to this company-specific challenge, B of A Securities trimmed its price target for AGI from $57.00 to $50.00 on June 22, 2026.
Show more
Alamos Gold (AGI) stock has lost about 30% since 3/31/2026 because of the following key factors:
Alamos Gold (AGI) experienced a significant stock decline of approximately 30% since fiscal Q1 2026, driven by a combination of company-specific operational challenges and broader macroeconomic shifts affecting the gold market.
1. Q1 2026 Earnings Miss and Elevated Costs.
Alamos Gold reported Q1 2026 adjusted earnings per share (EPS) of $0.55, falling short of some analyst consensus estimates, notably missing the $0.6059 forecast by 9.23% and the $0.6426 estimate by 14.41%. This earnings miss, coupled with all-in sustaining costs (AISC) of $1,862 per ounce that exceeded first-half guidance due to ongoing inflationary pressures on labor, energy, and consumables, contributed to a post-earnings stock decline of approximately 2.6% in after-hours trading.
2. Q2 2026 Production Cut from Operational Disruptions.
The company announced a significant reduction in its fiscal Q2 2026 production guidance to 130,000–135,000 ounces following seismic events and a power outage at its Young-Davidson mine. This operational setback prompted a revision of the full-year production outlook, which is now expected to be below the previously guided floor of 570,000 ounces. In response to this company-specific challenge, B of A Securities trimmed its price target for AGI from $57.00 to $50.00 on June 22, 2026.
3. Macroeconomic Headwinds and Declining Gold Prices.
A broader downturn in gold prices significantly impacted Alamos Gold, a major gold producer. After reaching record highs above US$5,500 per ounce in January 2026, spot gold prices declined sharply through fiscal Q2 2026, dipping below US$4,000 per ounce in late June and recording an intraday low of $3,959.33 on June 24, 2026. This decline was primarily driven by macroeconomic factors, including a repricing of Federal Reserve policy toward potential interest rate hikes, a strengthening U.S. dollar, and easing geopolitical risk premiums following developments such as the interim peace agreement between the U.S. and Iran over the Strait of Hormuz.
Show less
Stock Movement Drivers
Fundamental Drivers
The -31.7% change in AGI stock from 3/31/2026 to 7/1/2026 was primarily driven by a -43.1% change in the company's P/E Multiple.| (LTM values as of) | 3312026 | 7012026 | Change |
|---|---|---|---|
| Stock Price ($) | 44.38 | 30.31 | -31.7% |
| Change Contribution By: | |||
| Total Revenues ($ Mil) | 1,809 | 2,072 | 14.6% |
| Net Income Margin (%) | 49.0% | 51.2% | 4.6% |
| P/E Multiple | 21.1 | 12.0 | -43.1% |
| Shares Outstanding (Mil) | 420 | 420 | 0.1% |
| Cumulative Contribution | -31.7% |
Market Drivers
3/31/2026 to 7/1/2026| Return | Correlation | |
|---|---|---|
| AGI | -31.7% | |
| Market (SPY) | 14.7% | 61.6% |
| Sector (XLB) | 2.1% | 55.5% |
Fundamental Drivers
The -21.3% change in AGI stock from 12/31/2025 to 7/1/2026 was primarily driven by a -60.1% change in the company's P/E Multiple.| (LTM values as of) | 12312025 | 7012026 | Change |
|---|---|---|---|
| Stock Price ($) | 38.50 | 30.31 | -21.3% |
| Change Contribution By: | |||
| Total Revenues ($ Mil) | 1,609 | 2,072 | 28.8% |
| Net Income Margin (%) | 33.5% | 51.2% | 53.1% |
| P/E Multiple | 30.1 | 12.0 | -60.1% |
| Shares Outstanding (Mil) | 420 | 420 | 0.1% |
| Cumulative Contribution | -21.3% |
Market Drivers
12/31/2025 to 7/1/2026| Return | Correlation | |
|---|---|---|
| AGI | -21.3% | |
| Market (SPY) | 9.7% | 43.5% |
| Sector (XLB) | 13.0% | 59.3% |
Fundamental Drivers
The 14.5% change in AGI stock from 6/30/2025 to 7/1/2026 was primarily driven by a 179.2% change in the company's Net Income Margin (%).| (LTM values as of) | 6302025 | 7012026 | Change |
|---|---|---|---|
| Stock Price ($) | 26.47 | 30.31 | 14.5% |
| Change Contribution By: | |||
| Total Revenues ($ Mil) | 1,402 | 2,072 | 47.8% |
| Net Income Margin (%) | 18.4% | 51.2% | 179.2% |
| P/E Multiple | 43.2 | 12.0 | -72.3% |
| Shares Outstanding (Mil) | 420 | 420 | 0.1% |
| Cumulative Contribution | 14.5% |
Market Drivers
6/30/2025 to 7/1/2026| Return | Correlation | |
|---|---|---|
| AGI | 14.5% | |
| Market (SPY) | 21.7% | 36.0% |
| Sector (XLB) | 17.9% | 48.2% |
Fundamental Drivers
The 158.2% change in AGI stock from 6/30/2023 to 7/1/2026 was primarily driven by a 384.2% change in the company's Net Income Margin (%).| (LTM values as of) | 6302023 | 7012026 | Change |
|---|---|---|---|
| Stock Price ($) | 11.74 | 30.31 | 158.2% |
| Change Contribution By: | |||
| Total Revenues ($ Mil) | 888 | 2,072 | 133.3% |
| Net Income Margin (%) | 10.6% | 51.2% | 384.2% |
| P/E Multiple | 49.2 | 12.0 | -75.6% |
| Shares Outstanding (Mil) | 394 | 420 | -6.2% |
| Cumulative Contribution | 158.2% |
Market Drivers
6/30/2023 to 7/1/2026| Return | Correlation | |
|---|---|---|
| AGI | 158.2% | |
| Market (SPY) | 74.2% | 27.0% |
| Sector (XLB) | 30.0% | 39.2% |
Price Returns Compared
| 2021 | 2022 | 2023 | 2024 | 2025 | 2026 | Total [1] | |
|---|---|---|---|---|---|---|---|
| Returns | |||||||
| AGI Return | -11% | 33% | 34% | 38% | 110% | -21% | 263% |
| Peers Return | 17% | -7% | 7% | 14% | 123% | -5% | 183% |
| S&P 500 Return | 27% | -19% | 24% | 23% | 16% | 10% | 100% |
Monthly Win Rates [3] | |||||||
| AGI Win Rate | 58% | 58% | 58% | 50% | 75% | 33% | |
| Peers Win Rate | 45% | 48% | 57% | 52% | 77% | 43% | |
| S&P 500 Win Rate | 75% | 42% | 67% | 75% | 67% | 50% | |
Max Drawdowns [4] | |||||||
| AGI Max Drawdown | -28% | -28% | -21% | -18% | -21% | -45% | |
| Peers Max Drawdown | -34% | -46% | -33% | -30% | -25% | -37% | |
| S&P 500 Max Drawdown | -5% | -25% | -10% | -8% | -19% | -9% | |
[1] Cumulative total returns since the beginning of 2021
[2] Peers: AEM, GOLD, NEM, KGC, BTG.
[3] Win Rate = % of calendar months in which monthly returns were positive
[4] Max drawdown represents maximum peak-to-trough decline within a year
[5] 2026 data is for the year up to 7/1/2026 (YTD)
How Low Can It Go
| Event | AGI | S&P 500 |
|---|---|---|
| Summer-Fall 2023 Five Percent Yield Shock | ||
| % Loss | -12.0% | -9.5% |
| % Gain to Breakeven | 13.7% | 10.5% |
| Time to Breakeven | 15 days | 24 days |
| 2022 Inflation Shock & Fed Tightening | ||
| % Loss | -12.5% | -24.5% |
| % Gain to Breakeven | 14.3% | 32.4% |
| Time to Breakeven | 4 days | 427 days |
| 2020 COVID-19 Crash | ||
| % Loss | -40.4% | -33.7% |
| % Gain to Breakeven | 67.9% | 50.9% |
| Time to Breakeven | 31 days | 140 days |
| Q4 2018 Fed Policy Error / Growth Scare | ||
| % Loss | -36.3% | -19.2% |
| % Gain to Breakeven | 56.9% | 23.8% |
| Time to Breakeven | 67 days | 105 days |
| 2016-2017 Trump Reflation Bond Selloff | ||
| % Loss | -26.2% | -3.7% |
| % Gain to Breakeven | 35.5% | 3.9% |
| Time to Breakeven | 27 days | 6 days |
| 2015-2016 China Devaluation / Global Growth Scare | ||
| % Loss | -38.9% | -12.2% |
| % Gain to Breakeven | 63.7% | 13.9% |
| Time to Breakeven | 16 days | 62 days |
In The Past
Alamos Gold's stock fell -0.2% during the 2025 US Tariff Shock. Such a loss loss requires a 0.2% gain to breakeven.
Preserve Wealth
Limiting losses and compounding gains is essential to preserving wealth.
Asset Allocation
Actively managed asset allocation strategies protect wealth. Learn more.
| Event | AGI | S&P 500 |
|---|---|---|
| 2020 COVID-19 Crash | ||
| % Loss | -40.4% | -33.7% |
| % Gain to Breakeven | 67.9% | 50.9% |
| Time to Breakeven | 31 days | 140 days |
| Q4 2018 Fed Policy Error / Growth Scare | ||
| % Loss | -36.3% | -19.2% |
| % Gain to Breakeven | 56.9% | 23.8% |
| Time to Breakeven | 67 days | 105 days |
| 2016-2017 Trump Reflation Bond Selloff | ||
| % Loss | -26.2% | -3.7% |
| % Gain to Breakeven | 35.5% | 3.9% |
| Time to Breakeven | 27 days | 6 days |
| 2015-2016 China Devaluation / Global Growth Scare | ||
| % Loss | -38.9% | -12.2% |
| % Gain to Breakeven | 63.7% | 13.9% |
| Time to Breakeven | 16 days | 62 days |
| 2014-2016 Oil Price Collapse | ||
| % Loss | -74.5% | -6.8% |
| % Gain to Breakeven | 292.7% | 7.3% |
| Time to Breakeven | 163 days | 15 days |
| 2013 Taper Tantrum | ||
| % Loss | -36.5% | -0.2% |
| % Gain to Breakeven | 57.5% | 0.2% |
| Time to Breakeven | 3362 days | 1 days |
| 2011 US Debt Ceiling Crisis & European Contagion | ||
| % Loss | -26.0% | -17.9% |
| % Gain to Breakeven | 35.2% | 21.8% |
| Time to Breakeven | 23 days | 123 days |
In The Past
Alamos Gold's stock fell -0.2% during the 2025 US Tariff Shock. Such a loss loss requires a 0.2% gain to breakeven.
Preserve Wealth
Limiting losses and compounding gains is essential to preserving wealth.
Asset Allocation
Actively managed asset allocation strategies protect wealth. Learn more.
About Alamos Gold (AGI)
Alamos Gold Inc. is a Canadian-based mining company primarily focused on the acquisition, exploration, development, and extraction of precious metals. The company's core operations involve finding, developing, and operating mines that produce gold and silver. Its operational footprint is geographically diverse, with activities spanning across Canada, Mexico, the United States, and Turkey.
The main products of Alamos Gold are gold and silver, which it extracts from its various mining properties. Key assets contributing to its production include two prominent mines in Ontario, Canada: the Young-Davidson mine, which serves as its flagship project, and the Island Gold mine. These mines are crucial to the company's output of precious metals.
As a producer of gold and silver, Alamos Gold serves the global precious metals market. Its primary customers are those involved in the buying, selling, and holding of these commodities, including financial institutions, central banks, industrial users, and the jewelry sector worldwide. The company's business relies on the global demand for and market prices of gold and silver.
```AI Analysis | Feedback
ExxonMobil for gold.
AI Analysis | Feedback
- Gold: Alamos Gold extracts and sells gold from its various mining operations.
- Silver: The company also explores for and extracts silver as a precious metal byproduct or primary product.
AI Analysis | Feedback
Alamos Gold Inc. (AGI) operates in the precious metals mining sector, primarily extracting gold and silver. As such, its product is a raw or semi-processed commodity (typically in the form of doré bars or concentrates).
Due to the fungible nature of commodities and the liquid global market for precious metals, gold mining companies like Alamos Gold Inc. generally do not publicly disclose the names of their specific major customers. Instead, they sell their output into the market at prevailing prices to a range of specialized entities within the precious metals supply chain.
The primary categories of customers that Alamos Gold Inc. would typically sell its gold and silver to are:
- Precious Metal Refiners: Companies that specialize in purifying raw or semi-processed precious metals (like doré bars) into high-purity bullion suitable for investment, industrial, and jewelry manufacturing purposes.
- Bullion Banks and Financial Institutions: Large banks and financial firms that act as intermediaries in the physical precious metals market, often buying from miners for their own trading operations or for resale to other clients.
- Commodity Trading Houses: Firms that specialize in the large-scale buying, selling, and logistics of raw materials, including precious metals, on a global scale.
AI Analysis | Feedback
AI Analysis | Feedback
AI Analysis | Feedback
The key risks to Alamos Gold Inc.'s business (AGI) are primarily tied to commodity price fluctuations, operational challenges including the execution of expansion projects and weather-related disruptions, and jurisdictional and regulatory changes.
- Gold Price Volatility: The price of gold is the most significant factor affecting Alamos Gold's profitability. Significant declines in gold prices could quickly compress profit margins, directly impacting the company's revenue and financial performance.
- Operational Risks: This category encompasses several critical factors. The successful execution of large mining expansion projects, such as the Island Gold expansion, is vital for the company's growth, but these projects inherently carry risks of cost overruns, delays, and technical issues. Furthermore, mining operations are exposed to inherent geological uncertainties, equipment failures, safety risks, and production disruptions. Specifically, operations in northern climates, like Canada, face challenges from extreme weather conditions that can lead to production shortfalls, as experienced in 2025 at the Island Gold and Young-Davidson mines due to severe winter weather and other operational issues. The geographic concentration of a significant portion of the company's production from a single asset, such as the Island Gold District, also amplifies the impact of any operational disruptions at that site.
- Jurisdictional and Regulatory Risks: Although Alamos Gold operates primarily in politically stable jurisdictions like Canada and Mexico, the company remains subject to various governmental, regulatory, and environmental risks. Changes in national and local legislation, environmental requirements, or tax policies could negatively affect operations. The ability to obtain and maintain necessary licenses, permits, and authorizations for its development-stage and operating assets is also a continuous risk.
AI Analysis | Feedback
The emergence and increasing adoption of digital assets, particularly cryptocurrencies like Bitcoin, as an alternative store of value. These digital assets are often touted as "digital gold" and compete with physical gold for investor capital seeking a hedge against inflation or a non-sovereign asset. A significant long-term shift of investment demand from physical gold to digital alternatives could reduce the overall market demand for gold, impacting gold prices and the profitability of gold mining operations.
AI Analysis | Feedback
Addressable Markets for Alamos Gold (AGI)
Alamos Gold Inc. primarily explores for and extracts gold and silver. The addressable markets for these precious metals are global.
Gold Market
The global gold market size is estimated to be 4,890.0 tons in 2025. It is projected to grow from 5,118.1 tons in 2026 to 7,424.4 tons by 2034, with a compound annual growth rate (CAGR) of 4.70% during this forecast period. In terms of value, the global gold market was estimated at USD 291.68 billion in 2024 and is projected to reach USD 400 billion by the end of 2030, growing at a CAGR of 6.51% from 2025-2030.
Silver Market
The global silver market size is expected to reach 37.78 kilotons in 2025. This market is forecast to grow to 49.54 kilotons by 2031, with a CAGR of 4.62% between 2026 and 2031. The global silver market was valued at USD 87.12 billion in 2024 and is projected to grow to USD 202.07 billion by 2033, exhibiting a CAGR of 9.86% during the forecast period (2025-2033).
AI Analysis | Feedback
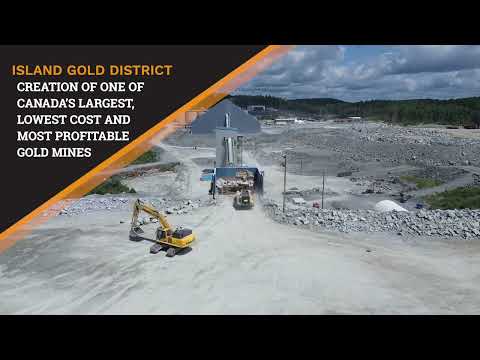
- Island Gold District Expansion: A significant driver of revenue growth is the multi-phase expansion of the Island Gold District in Ontario, Canada, which includes the Island Gold underground mine and the Magino open-pit mine. This expansion is projected to nearly double the district's value and lead to a substantial increase in annual gold production to an average of 534,000 ounces over the initial 10 years post-2028, representing a 113% increase from 2025 production. Key aspects of this expansion involve doubling mill capacity to 20,000 tonnes per day and increasing underground mining rates.
- Increased Production at Young-Davidson Mine: The Young-Davidson mine, located in Northern Ontario, Canada, is anticipated to contribute to revenue growth through higher underground mining rates. Production at Young-Davidson is expected to increase by approximately 8% in 2026 relative to 2025, driven by improved ore pass availability and capacity.
- Commencement of Production from the PDA Project: The PDA (Palo Duro) project in Mexico, part of the Mulatos District, is slated to begin initial production by mid-2027. This new source of gold production will add to Alamos Gold's overall output and, consequently, its revenue.
- Ongoing Exploration Success and Reserve Growth: Alamos Gold's consistent investment in exploration, particularly within the Island Gold District, has resulted in significant increases in mineral reserves. The company reported a 32% increase in year-end mineral reserves to 16 million ounces in 2025, marking the seventh consecutive year of growth. This expansion of the reserve base underpins longer mine lives and provides the foundation for sustained future production.
- Exposure to Higher Realized Gold Prices: While subject to market dynamics, Alamos Gold has strategically increased its exposure to gold prices by reducing hedges inherited from past transactions. Higher realized gold prices have historically boosted the company's revenue, and with increased unhedged production from its growth projects, the company is positioned to benefit further from favorable gold market conditions.
AI Analysis | Feedback
Share Repurchases
- Alamos Gold received approval to repurchase up to 18.58 million Class A common shares (approximately 4.4% of total outstanding shares) between December 24, 2025, and December 23, 2026.
- In the previous program, ending December 2025, Alamos repurchased 1.33 million shares for C$54.4 million (approximately $38.8 million).
- The company renewed its Normal Course Issuer Bid to repurchase up to 18,605,661 Class A Common Shares from December 24, 2024, to December 23, 2025, with the aim of enhancing shareholder value.
Inbound Investments
- Van ECK Associates Corp significantly increased its stake in Alamos Gold by 35.3% in Q3, acquiring 11,876,324 shares to hold a total of 45,544,137 shares, valued at approximately $1.59 billion, representing 10.83% of the company.
- Several other major institutions, including Vanguard, CIBC Asset Management, Mackenzie, and Geode, also increased their positions, while Norges Bank initiated a new stake, contributing to institutional investors owning roughly 64.33% of Alamos Gold's stock.
Outbound Investments
- In April 2024, Alamos Gold acquired Orford Mining Corporation and its wholly-owned Qiqavik Gold Project in Nunavik, Quebec.
Capital Expenditures
- Capital spending is projected to increase to between $850 and $940 million in 2026 (excluding capitalized exploration), primarily due to the Island Gold District (IGD) Expansion, accelerated spending at Canadian mine sites, and ongoing inflation.
- From 2022 to 2024, total capital expenditures exceeded $1.1 billion, reflecting significant investments in exploration and mine development.
- A primary focus of capital expenditures is the Island Gold District Expansion, with an expected $355 million to $385 million in growth capital for 2026, alongside investments in the Lynn Lake project and PDA development.
Latest Trefis Analyses
Research & Analysis
Invest in Strategies
Wealth Management
Peer Comparisons
| Peers to compare with: |
Financials
| Median | |
|---|---|
| Name | |
| Mkt Price | 36.42 |
| Mkt Cap | 20.4 |
| Rev LTM | 10,750 |
| Op Inc LTM | 2,882 |
| FCF LTM | 2,145 |
| FCF 3Y Avg | 1,345 |
| CFO LTM | 2,780 |
| CFO 3Y Avg | 1,921 |
Growth & Margins
| Median | |
|---|---|
| Name | |
| Rev Chg LTM | 49.8% |
| Rev Chg 3Y Avg | 31.9% |
| Rev Chg Q | 72.6% |
| QoQ Delta Rev Chg LTM | 14.1% |
| Op Inc Chg LTM | 115.6% |
| Op Inc Chg 3Y Avg | 78.3% |
| Op Mgn LTM | 52.1% |
| Op Mgn 3Y Avg | 36.0% |
| QoQ Delta Op Mgn LTM | 4.2% |
| CFO/Rev LTM | 47.3% |
| CFO/Rev 3Y Avg | 42.2% |
| FCF/Rev LTM | 33.7% |
| FCF/Rev 3Y Avg | 22.1% |
Segment Financials
Revenue by Segment| $ Mil | 2025 | 2024 | 2023 | 2022 | 2021 |
|---|---|---|---|---|---|
| Island Gold District | 834 | 363 | 248 | 235 | 252 |
| Young-Davidson | 534 | 415 | 355 | 348 | 350 |
| Mulatos | 486 | 487 | 420 | 238 | 221 |
| Corporate/other | -45 | 0 | 0 | ||
| Magino | 81 | ||||
| Total | 1,809 | 1,347 | 1,023 | 821 | 824 |
| $ Mil | 2025 | 2024 | 2023 | 2022 | 2021 |
|---|---|---|---|---|---|
| Island Gold District | 484 | 226 | 120 | 110 | 135 |
| Mulatos | 284 | 191 | 144 | -7 | 36 |
| Young-Davidson | 261 | 208 | 104 | 93 | 105 |
| Corporate/other | 69 | -69 | -51 | -84 | -262 |
| Magino | 7 | ||||
| Total | 1,097 | 562 | 318 | 112 | 15 |
| $ Mil | 2025 | 2024 | 2023 | 2022 | 2021 |
|---|---|---|---|---|---|
| Island Gold District | 3,179 | 1,683 | 1,454 | 1,222 | 1,094 |
| Young-Davidson | 1,838 | 1,759 | 1,693 | 1,645 | 1,684 |
| Mulatos | 697 | 541 | 632 | 606 | 539 |
| Corporate/other | 670 | 280 | 223 | 201 | 304 |
| Magino | 1,074 | ||||
| Total | 6,385 | 5,336 | 4,001 | 3,674 | 3,622 |
Price Behavior
| Market Price | $30.31 | |
| Market Cap ($ Bil) | 12.7 | |
| First Trading Date | 02/13/2009 | |
| Distance from 52W High | -45.1% | |
| 50 Days | 200 Days | |
| DMA Price | $38.41 | $39.21 |
| DMA Trend | up | down |
| Distance from DMA | -21.1% | -22.7% |
| 3M | 1YR | |
| Volatility | 56.7% | 53.7% |
| Downside Capture | 494.97 | 207.38 |
| Upside Capture | 114.07 | 176.01 |
| Correlation (SPY) | 59.6% | 36.0% |
| 1M | 2M | 3M | 6M | 1Y | 3Y | |
|---|---|---|---|---|---|---|
| Beta | 2.37 | 2.81 | 2.57 | 1.95 | 1.55 | 0.75 |
| Up Beta | 1.71 | 2.45 | 1.94 | 1.76 | 1.58 | 0.58 |
| Down Beta | 1.42 | 2.31 | 2.62 | 1.39 | 0.65 | 0.53 |
| Up Capture | 132% | 185% | 136% | 214% | 267% | 127% |
| Bmk +ve Days | 11 | 24 | 40 | 67 | 140 | 429 |
| Stock +ve Days | 9 | 19 | 31 | 67 | 139 | 405 |
| Down Capture | 363% | 366% | 387% | 207% | 155% | 98% |
| Bmk -ve Days | 10 | 17 | 23 | 58 | 112 | 321 |
| Stock -ve Days | 12 | 22 | 32 | 58 | 113 | 340 |
[1] Upside and downside betas calculated using positive and negative benchmark daily returns respectively
Based On 1-Year Data
| Annualized Return | Annualized Volatility | Sharpe Ratio | Correlation with AGI | |
|---|---|---|---|---|
| AGI | 14.6% | 53.6% | 0.45 | - |
| Sector ETF (XLB) | 18.0% | 17.6% | 0.78 | 48.2% |
| Equity (SPY) | 21.8% | 12.5% | 1.30 | 36.0% |
| Gold (GLD) | 21.7% | 27.7% | 0.69 | 72.7% |
| Commodities (DBC) | 21.4% | 18.6% | 0.90 | 10.8% |
| Real Estate (VNQ) | 13.0% | 13.7% | 0.65 | 16.3% |
| Bitcoin (BTCUSD) | -45.0% | 42.6% | -1.28 | 24.9% |
Smart multi-asset allocation framework can stack odds in your favor. Learn How
Based On 5-Year Data
| Annualized Return | Annualized Volatility | Sharpe Ratio | Correlation with AGI | |
|---|---|---|---|---|
| AGI | 32.3% | 41.7% | 0.79 | - |
| Sector ETF (XLB) | 6.5% | 19.0% | 0.24 | 38.3% |
| Equity (SPY) | 13.5% | 17.1% | 0.61 | 26.4% |
| Gold (GLD) | 17.4% | 18.3% | 0.77 | 70.9% |
| Commodities (DBC) | 6.8% | 19.5% | 0.25 | 23.9% |
| Real Estate (VNQ) | 2.8% | 18.8% | 0.05 | 26.0% |
| Bitcoin (BTCUSD) | 11.9% | 53.7% | 0.41 | 18.3% |
Smart multi-asset allocation framework can stack odds in your favor. Learn How
Based On 10-Year Data
| Annualized Return | Annualized Volatility | Sharpe Ratio | Correlation with AGI | |
|---|---|---|---|---|
| AGI | 15.6% | 48.6% | 0.48 | - |
| Sector ETF (XLB) | 10.1% | 20.7% | 0.43 | 22.6% |
| Equity (SPY) | 15.4% | 18.0% | 0.73 | 14.9% |
| Gold (GLD) | 11.9% | 16.1% | 0.60 | 62.9% |
| Commodities (DBC) | 5.6% | 18.0% | 0.24 | 18.4% |
| Real Estate (VNQ) | 5.4% | 20.7% | 0.22 | 15.0% |
| Bitcoin (BTCUSD) | 56.6% | 66.3% | 0.97 | 13.1% |
Smart multi-asset allocation framework can stack odds in your favor. Learn How
Returns Analyses
Earnings Returns History
Updated 6/2/2026| Forward Returns | |||
|---|---|---|---|
| Earnings Date | 1D Returns | 5D Returns | 21D Returns |
| SUMMARY STATS | |||
| # Positive | 0 | 0 | 0 |
| # Negative | 0 | 0 | 0 |
| Median Positive | |||
| Median Negative | |||
| Max Positive | |||
| Max Negative | |||
| Forward Returns | |||
|---|---|---|---|
| Earnings Date | 1D Returns | 5D Returns | 21D Returns |
| SUMMARY STATS | |||
| # Positive | 0 | 0 | 0 |
| # Negative | 0 | 0 | 0 |
| Median Positive | |||
| Median Negative | |||
| Max Positive | |||
| Max Negative | |||
SEC Filings
Expand for More| Report Date | Filing Date | Filing |
|---|---|---|
| 12/31/2025 | 03/26/2026 | 40-F |
| 09/30/2025 | 10/30/2025 | 6-K |
| 06/30/2025 | 07/31/2025 | 6-K |
| 03/31/2025 | 05/01/2025 | 6-K |
| 12/31/2024 | 03/31/2025 | 40-F |
| 09/30/2024 | 11/07/2024 | 6-K |
| 06/30/2024 | 08/01/2024 | 6-K |
| 03/31/2024 | 04/25/2024 | 6-K |
| 12/31/2023 | 03/26/2024 | 40-F |
| 09/30/2023 | 10/26/2023 | 6-K |
| 06/30/2023 | 07/27/2023 | 6-K |
| 03/31/2023 | 04/28/2023 | 6-K |
| 12/31/2022 | 03/29/2023 | 40-F |
| 09/30/2022 | 10/27/2022 | 6-K |
| 06/30/2022 | 07/28/2022 | 6-K |
| 03/31/2022 | 04/28/2022 | 6-K |
| Report Date | Filing Date | Filing |
|---|---|---|
| 12/31/2025 | 03/26/2026 | 40-F |
| 09/30/2025 | 10/30/2025 | 6-K |
| 06/30/2025 | 07/31/2025 | 6-K |
| 03/31/2025 | 05/01/2025 | 6-K |
| 12/31/2024 | 03/31/2025 | 40-F |
| 09/30/2024 | 11/07/2024 | 6-K |
| 06/30/2024 | 08/01/2024 | 6-K |
| 03/31/2024 | 04/25/2024 | 6-K |
| 12/31/2023 | 03/26/2024 | 40-F |
| 09/30/2023 | 10/26/2023 | 6-K |
| 06/30/2023 | 07/27/2023 | 6-K |
| 03/31/2023 | 04/28/2023 | 6-K |
| 12/31/2022 | 03/29/2023 | 40-F |
| 09/30/2022 | 10/27/2022 | 6-K |
| 06/30/2022 | 07/28/2022 | 6-K |
| 03/31/2022 | 04/28/2022 | 6-K |
| 12/31/2021 | 03/30/2022 | 40-F |
| 09/30/2021 | 10/29/2021 | 6-K |
| 06/30/2021 | 07/29/2021 | 6-K |
| 03/31/2021 | 04/30/2021 | 6-K |
| 12/31/2020 | 03/30/2021 | 40-F |
| 09/30/2020 | 10/30/2020 | 6-K |
| 06/30/2020 | 07/30/2020 | 6-K |
| 03/31/2020 | 04/30/2020 | 6-K |
| 12/31/2019 | 03/27/2020 | 40-F |
| 09/30/2019 | 11/04/2019 | 6-K |
| 06/30/2019 | 08/02/2019 | 6-K |
| 03/31/2019 | 05/02/2019 | 6-K |
Alamos Gold — Investor Video Playlist


Industry Resources
| Materials Resources |
| Chemical & Engineering News (C&EN) |
| Mining.com |
| Plastics News |
| Gold Resources |
| Kitco News |
| World Gold Council |
| Mining Journal |
External Quote Links
| Y Finance | Barrons |
| TradingView | Morningstar |
| SeekingAlpha | ValueLine |
| Motley Fool | Robinhood |
| CNBC | Etrade |
| MarketWatch | Unusual Whales |
| YCharts | Perplexity Finance |
| FinViz |
Prefer one of these to Trefis? Tell us why.