AgEagle Aerial Systems (UAVS)
Market Price (7/23/2026): $0.714 | Market Cap: $38.1 MilSector: Information Technology | Industry: Technology Hardware, Storage & Peripherals
AgEagle Aerial Systems (UAVS)
Market Price (7/23/2026): $0.714Market Cap: $38.1 MilSector: Information TechnologyIndustry: Technology Hardware, Storage & Peripherals
Investment Highlights Why It Matters Detailed financial logic regarding cash flow yields vs trend-riding momentum.
Cash is significant % of market capNet D/ENet Debt/Equity. Debt net of cash. Negative indicates net cash. Equity is taken as the Market Capitalization is -85% Attractive yieldDividend Yield is 2.2% Megatrend and thematic driversMegatrends include Advanced Aviation & Space, and Autonomous Technologies. Themes include Drone Technology, and Machine Vision. | Weak multi-year price returns2Y Excs Rtn is -131%, 3Y Excs Rtn is -165% | Penny stockMkt Price is 0.7 Not profitable at operating income levelOp Inc LTMOperating Income, Last Twelve Months is -13 Mil, Op Mgn LTMOperating Margin = Operating Income / Revenue Reflects profitability before taxes and before impact of capital structure (interest payments). is -123% Weak revenue growthRev Chg LTMRevenue Change % Last Twelve Months (LTM) is -20%, Rev Chg 3Y AvgRevenue Change % averaged over trailing 3 years is -18%, Rev Chg QQuarterly Revenue Change % is -62% Not cash flow generativeCFO/Rev LTMCash Flow from Operations / Revenue (Sales), Last Twelve Months (LTM) is -104%, FCF/Rev LTMFree Cash Flow / Revenue (Sales), Last Twelve Months (LTM) is -108% Yield minus risk free rate is negativeERPEquity Risk Premium (ERP) = Total Yield - Risk Free Rate, Reflects the premium above risk free assets offered by the investment. is -31% High stock price volatilityVol 12M is 122% Key risksUAVS key risks include [1] significant financial distress, Show more. |
| Cash is significant % of market capNet D/ENet Debt/Equity. Debt net of cash. Negative indicates net cash. Equity is taken as the Market Capitalization is -85% |
| Attractive yieldDividend Yield is 2.2% |
| Megatrend and thematic driversMegatrends include Advanced Aviation & Space, and Autonomous Technologies. Themes include Drone Technology, and Machine Vision. |
| Weak multi-year price returns2Y Excs Rtn is -131%, 3Y Excs Rtn is -165% |
| Penny stockMkt Price is 0.7 |
| Not profitable at operating income levelOp Inc LTMOperating Income, Last Twelve Months is -13 Mil, Op Mgn LTMOperating Margin = Operating Income / Revenue Reflects profitability before taxes and before impact of capital structure (interest payments). is -123% |
| Weak revenue growthRev Chg LTMRevenue Change % Last Twelve Months (LTM) is -20%, Rev Chg 3Y AvgRevenue Change % averaged over trailing 3 years is -18%, Rev Chg QQuarterly Revenue Change % is -62% |
| Not cash flow generativeCFO/Rev LTMCash Flow from Operations / Revenue (Sales), Last Twelve Months (LTM) is -104%, FCF/Rev LTMFree Cash Flow / Revenue (Sales), Last Twelve Months (LTM) is -108% |
| Yield minus risk free rate is negativeERPEquity Risk Premium (ERP) = Total Yield - Risk Free Rate, Reflects the premium above risk free assets offered by the investment. is -31% |
| High stock price volatilityVol 12M is 122% |
| Key risksUAVS key risks include [1] significant financial distress, Show more. |
Qualitative Assessment
AI Analysis | Feedback
AgEagle Aerial Systems (UAVS) stock has lost about 20% since 3/31/2026 because of the following key factors:
1. AgEagle Aerial Systems experienced a substantial year-over-year revenue decline in fiscal Q1 2026. The company's revenue dropped by 61.6% to $1.4 million in fiscal Q1 2026, down from $3.6 million in the prior-year quarter. This decline was attributed to weaker drone and sensor sales, delays in national contracts, extended deal-closing cycles, and the U.S. federal government shutdown affecting demand for drone products.
2. The company reported a significantly widened operating loss in fiscal Q1 2026. AgEagle's operating loss expanded to $5.1 million in fiscal Q1 2026, compared to an operating loss of $1.0 million in fiscal Q1 2025. This was driven by increased operating expenses, including higher spending on research and development, sales, and administrative functions, as well as costs associated with opening its new Texas facility.
Show more
AgEagle Aerial Systems (UAVS) stock has lost about 20% since 3/31/2026 because of the following key factors:
1. AgEagle Aerial Systems experienced a substantial year-over-year revenue decline in fiscal Q1 2026. The company's revenue dropped by 61.6% to $1.4 million in fiscal Q1 2026, down from $3.6 million in the prior-year quarter. This decline was attributed to weaker drone and sensor sales, delays in national contracts, extended deal-closing cycles, and the U.S. federal government shutdown affecting demand for drone products.
2. The company reported a significantly widened operating loss in fiscal Q1 2026. AgEagle's operating loss expanded to $5.1 million in fiscal Q1 2026, compared to an operating loss of $1.0 million in fiscal Q1 2025. This was driven by increased operating expenses, including higher spending on research and development, sales, and administrative functions, as well as costs associated with opening its new Texas facility.
3. Net income in fiscal Q1 2026 was largely due to non-operating investment gains, masking a weak core business. Although AgEagle reported a net income of $1.4 million for fiscal Q1 2026, this was primarily due to a $6.5 million unrealized gain on a new equity investment in Aerodrome Group. Analysts noted this gain was non-operating and did not reflect a turnaround in the company's underlying business performance, which saw core revenue and margins deteriorate materially.
4. Ongoing equity dilution and increased operating cash outflow negatively impacted shareholder value. Shares outstanding rose to 57.3 million, primarily from preferred stock conversions and warrant exercises, indicating significant equity dilution for existing shareholders. Additionally, operating cash outflow widened to $2.36 million in fiscal Q1 2026, up from $1.29 million in the prior-year quarter, reflecting continued cash burn from operations.
Show less
Stock Movement Drivers
Fundamental Drivers
The -20.8% change in UAVS stock from 3/31/2026 to 7/22/2026 was primarily driven by a -18.3% change in the company's Shares Outstanding (Mil).| (LTM values as of) | 3312026 | 7222026 | Change |
|---|---|---|---|
| Stock Price ($) | 0.90 | 0.72 | -20.8% |
| Change Contribution By: | |||
| Total Revenues ($ Mil) | 13 | 11 | -17.5% |
| P/S Multiple | 3.1 | 3.6 | 17.6% |
| Shares Outstanding (Mil) | 44 | 53 | -18.3% |
| Cumulative Contribution | -20.8% |
Market Drivers
3/31/2026 to 7/22/2026| Return | Correlation | |
|---|---|---|
| UAVS | -20.8% | |
| Market (SPY) | 14.9% | 50.1% |
| Sector (XLK) | 35.6% | 51.3% |
Fundamental Drivers
The -12.0% change in UAVS stock from 12/31/2025 to 7/22/2026 was primarily driven by a -39.7% change in the company's Shares Outstanding (Mil).| (LTM values as of) | 12312025 | 7222026 | Change |
|---|---|---|---|
| Stock Price ($) | 0.81 | 0.72 | -12.0% |
| Change Contribution By: | |||
| Total Revenues ($ Mil) | 13 | 11 | -16.4% |
| P/S Multiple | 2.1 | 3.6 | 74.7% |
| Shares Outstanding (Mil) | 32 | 53 | -39.7% |
| Cumulative Contribution | -12.0% |
Market Drivers
12/31/2025 to 7/22/2026| Return | Correlation | |
|---|---|---|
| UAVS | -12.0% | |
| Market (SPY) | 9.9% | 26.1% |
| Sector (XLK) | 25.4% | 23.4% |
Fundamental Drivers
The -30.5% change in UAVS stock from 6/30/2025 to 7/22/2026 was primarily driven by a -78.2% change in the company's Shares Outstanding (Mil).| (LTM values as of) | 6302025 | 7222026 | Change |
|---|---|---|---|
| Stock Price ($) | 1.03 | 0.72 | -30.5% |
| Change Contribution By: | |||
| Total Revenues ($ Mil) | 13 | 11 | -19.7% |
| P/S Multiple | 0.9 | 3.6 | 296.5% |
| Shares Outstanding (Mil) | 12 | 53 | -78.2% |
| Cumulative Contribution | -30.5% |
Market Drivers
6/30/2025 to 7/22/2026| Return | Correlation | |
|---|---|---|
| UAVS | -30.5% | |
| Market (SPY) | 22.0% | 28.8% |
| Sector (XLK) | 43.0% | 23.6% |
Fundamental Drivers
The -99.7% change in UAVS stock from 6/30/2023 to 7/22/2026 was primarily driven by a -99.8% change in the company's Shares Outstanding (Mil).| (LTM values as of) | 6302023 | 7222026 | Change |
|---|---|---|---|
| Stock Price ($) | 230.00 | 0.72 | -99.7% |
| Change Contribution By: | |||
| Total Revenues ($ Mil) | 19 | 11 | -45.3% |
| P/S Multiple | 1.1 | 3.6 | 238.9% |
| Shares Outstanding (Mil) | 0 | 53 | -99.8% |
| Cumulative Contribution | -99.7% |
Market Drivers
6/30/2023 to 7/22/2026| Return | Correlation | |
|---|---|---|
| UAVS | -99.7% | |
| Market (SPY) | 74.6% | 15.8% |
| Sector (XLK) | 111.3% | 14.5% |
Price Returns Compared
| 2021 | 2022 | 2023 | 2024 | 2025 | 2026 | Total [1] | |
|---|---|---|---|---|---|---|---|
| Returns | |||||||
| UAVS Return | -74% | -78% | -70% | -97% | -77% | -8% | -100% |
| Peers Return | -9% | -27% | 31% | 31% | 109% | -21% | 90% |
| S&P 500 Return | 27% | -19% | 24% | 23% | 16% | 10% | 100% |
Monthly Win Rates [3] | |||||||
| UAVS Win Rate | 17% | 17% | 42% | 17% | 25% | 43% | |
| Peers Win Rate | 43% | 42% | 58% | 50% | 58% | 40% | |
| S&P 500 Win Rate | 75% | 42% | 67% | 75% | 67% | 57% | |
Max Drawdowns [4] | |||||||
| UAVS Max Drawdown | -90% | -82% | -82% | -99% | -78% | -59% | |
| Peers Max Drawdown | -38% | -50% | -34% | -33% | -41% | -48% | |
| S&P 500 Max Drawdown | -5% | -25% | -10% | -8% | -19% | -9% | |
[1] Cumulative total returns since the beginning of 2021
[2] Peers: AVAV, TDY, TRMB, KTOS, ONDS.
[3] Win Rate = % of calendar months in which monthly returns were positive
[4] Max drawdown represents maximum peak-to-trough decline within a year
[5] 2026 data is for the year up to 7/22/2026 (YTD)
How Low Can It Go
| Event | UAVS | S&P 500 |
|---|---|---|
| 2025 US Tariff Shock | ||
| % Loss | -56.6% | -18.8% |
| % Gain to Breakeven | 130.7% | 23.1% |
| Time to Breakeven | 78 days | 79 days |
| 2024 Yen Carry Trade Unwind | ||
| % Loss | -15.1% | -7.8% |
| % Gain to Breakeven | 17.8% | 8.5% |
| Time to Breakeven | 13 days | 18 days |
| 2020 COVID-19 Crash | ||
| % Loss | -42.5% | -33.7% |
| % Gain to Breakeven | 73.8% | 50.9% |
| Time to Breakeven | 28 days | 140 days |
| Q4 2018 Fed Policy Error / Growth Scare | ||
| % Loss | -59.8% | -19.2% |
| % Gain to Breakeven | 148.9% | 23.8% |
| Time to Breakeven | 482 days | 105 days |
| 2016-2017 Trump Reflation Bond Selloff | ||
| % Loss | -27.9% | -3.7% |
| % Gain to Breakeven | 38.7% | 3.9% |
| Time to Breakeven | 40 days | 6 days |
| 2013 Taper Tantrum | ||
| % Loss | -25.0% | -0.2% |
| % Gain to Breakeven | 33.3% | 0.2% |
| Time to Breakeven | 41 days | 1 days |
In The Past
AgEagle Aerial Systems's stock fell -56.6% during the 2025 US Tariff Shock. Such a loss loss requires a 130.7% gain to breakeven.
Preserve Wealth
Limiting losses and compounding gains is essential to preserving wealth.
Asset Allocation
Actively managed asset allocation strategies protect wealth. Learn more.
| Event | UAVS | S&P 500 |
|---|---|---|
| 2025 US Tariff Shock | ||
| % Loss | -56.6% | -18.8% |
| % Gain to Breakeven | 130.7% | 23.1% |
| Time to Breakeven | 78 days | 79 days |
| 2020 COVID-19 Crash | ||
| % Loss | -42.5% | -33.7% |
| % Gain to Breakeven | 73.8% | 50.9% |
| Time to Breakeven | 28 days | 140 days |
| Q4 2018 Fed Policy Error / Growth Scare | ||
| % Loss | -59.8% | -19.2% |
| % Gain to Breakeven | 148.9% | 23.8% |
| Time to Breakeven | 482 days | 105 days |
| 2016-2017 Trump Reflation Bond Selloff | ||
| % Loss | -27.9% | -3.7% |
| % Gain to Breakeven | 38.7% | 3.9% |
| Time to Breakeven | 40 days | 6 days |
| 2013 Taper Tantrum | ||
| % Loss | -25.0% | -0.2% |
| % Gain to Breakeven | 33.3% | 0.2% |
| Time to Breakeven | 41 days | 1 days |
| 2011 US Debt Ceiling Crisis & European Contagion | ||
| % Loss | -47.1% | -17.9% |
| % Gain to Breakeven | 88.9% | 21.8% |
| Time to Breakeven | 65 days | 123 days |
| 2010 Eurozone Sovereign Debt Crisis / Flash Crash | ||
| % Loss | -52.4% | -15.4% |
| % Gain to Breakeven | 110.0% | 18.2% |
| Time to Breakeven | 230 days | 125 days |
In The Past
AgEagle Aerial Systems's stock fell -56.6% during the 2025 US Tariff Shock. Such a loss loss requires a 130.7% gain to breakeven.
Preserve Wealth
Limiting losses and compounding gains is essential to preserving wealth.
Asset Allocation
Actively managed asset allocation strategies protect wealth. Learn more.
About AgEagle Aerial Systems (UAVS)
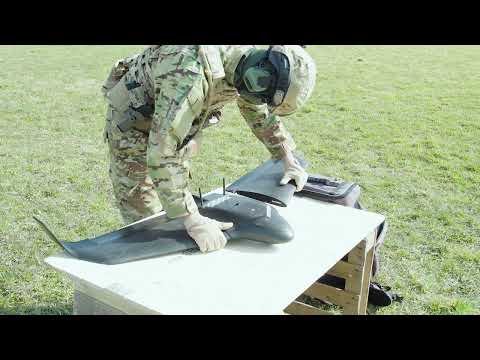
AgEagle Aerial Systems (UAVS) is a technology company specializing in the design and delivery of autonomous unmanned aerial systems, commonly known as drones. The company's business is structured across three primary segments: the manufacturing of drones and custom solutions, the development and provision of specialized sensor technologies for data collection, and a robust suite of Software-as-a-Service (SaaS) offerings for drone operations and data analysis.
AgEagle's product portfolio includes a range of fixed-wing drones such as the eBee Ag, eBee Geo, eBee TAC, and eBee X, designed for various professional applications. Complementing its drone hardware, the company offers advanced sensor solutions like the Altum-PT, RedEdge-MX, and S.O.D.A. series, which capture critical data for specific industry needs. Its SaaS solutions are comprehensive, featuring FarmLens for agricultural analytics, HempOverview for streamlining hemp cultivation, Ground Control for automating drone workflow operations, and eMotion for flight planning and data management.
The company primarily targets professional and industrial clients across a diverse set of global markets. Its key customer segments include the energy and utilities sector for infrastructure inspection, the agriculture industry for crop monitoring and yield optimization, government entities for various operational needs, and other infrastructure-related applications. AgEagle aims to provide end-to-end drone solutions that enhance efficiency, data collection, and decision-making for these specialized industries.
AI Analysis | Feedback
Here are 1-3 brief analogies to describe AgEagle Aerial Systems (UAVS):
- AgEagle is like a DJI for industrial and commercial drone applications.
- It's akin to a Trimble for drone-based industrial data and analytics.
- Think of it as a Tesla for autonomous industrial drones and their software ecosystems.
AI Analysis | Feedback
- Fixed-Wing Drones: Autonomous unmanned aerial systems designed for various industrial applications including energy, infrastructure, agriculture, and government.
- Drone Sensor Solutions: Specialized camera and imaging systems used to collect diverse data, such as multispectral, thermal, and photogrammetry data, from drones.
- FarmLens: A subscription cloud analytics service that processes drone-collected data for use by farmers and agronomists.
- HempOverview: Web- and map-based technologies designed to streamline and standardize hemp cultivation processes.
- Ground Control: Software that enables individual pilots and large enterprises to automate and scale drone operations workflows.
- eMotion: Solutions for drone flight planning, execution, and data management.
AI Analysis | Feedback
Major Customers of AgEagle Aerial Systems (UAVS)
AgEagle Aerial Systems, Inc. primarily sells its autonomous unmanned aerial systems, sensor solutions, and software products and services to other companies and government entities.
Based on the provided information, specific names of customer companies are not detailed. However, the company targets and serves major customers that are organizations operating within the following industries:
- Energy/Utilities industries
- Infrastructure industries
- Agriculture industries
- Government industries
AI Analysis | Feedback
AI Analysis | Feedback
Bill Irby, Chief Executive Officer
Bill Irby was appointed Chief Executive Officer in April 2024. He brings over 25 years of senior management expertise in uncrewed air and maritime systems, ISR systems, actuation hardware, and communication systems. Prior to joining AgEagle, he served as President of MTI and Steel Partners Holdings, and as Vice President at Northrop Grumman. Mr. Irby is also an active Board member of Ghost Robotics and the Chairman of the Association for Uncrewed Vehicle Systems International (AUVSI).
Alison Burgett, Chief Financial Officer
Alison Burgett was appointed Chief Financial Officer, effective April 14, 2025. She previously served as AgEagle's Controller since April 2024. Ms. Burgett has over two decades of financial leadership experience, having held significant finance leadership roles at Cente Corporation, Republic Services, Inc., and Providence Service Corporation prior to her tenure at AgEagle.
Brent Pope, Chief Operating Officer
Brent Pope was appointed Chief Operating Officer effective November 14, 2024. He has nearly 30 years of experience in manufacturing, sales, and engineering leadership. His previous roles include Vice President and General Manager of Rockwell American, a division of DexKo Global, and various positions at General Dynamics' AxleTech division, Ebasco, and the Jacobs Group.
Grant Begley, Chairman of the Board
Grant Begley was appointed Chairman of the Board in October 2023. He is a globally recognized expert in Aerospace, Unmanned Systems, and Robotics, and is the President of Concepts to Capabilities Consulting, LLC, a firm he founded in 2011. Mr. Begley retired from the United States Navy after 26 years of service as an officer, where he led operational assignments flying fighter aircraft and managed the development of next-generation manned and unmanned aerial systems. He also served as CEO of Vaya Space from 2018 through 2022.
AI Analysis | Feedback
The key risks to AgEagle Aerial Systems (UAVS) are primarily centered around its financial health, competitive landscape, and capital structure.
-
Ongoing Profitability Challenges and Financial Instability: AgEagle Aerial Systems has a history of operating losses, negative cash flow, and significant cash burn, leading to financial instability. The company has reported a working capital deficit and its financial health indicators, such as the Altman Z-Score, suggest potential financial distress. This prolonged lack of profitability and the need for external financing pose a significant threat to its long-term sustainability.
-
Intense Competition and Market Position: AgEagle operates in a highly competitive and fragmented unmanned aerial systems market, facing much larger and better-capitalized competitors like DJI and AeroVironment. This intense competition makes it challenging for AgEagle to gain substantial market share, protect its profit margins, and establish a dominant or defensible niche across its drone, sensor, and software segments.
-
Shareholder Dilution and Stock Price Volatility: The company has frequently issued new stock to raise necessary capital, resulting in substantial dilution for existing shareholders. Coupled with financial instability and operational challenges, AgEagle's stock price has experienced high volatility and significant underperformance compared to the broader market, reflecting considerable investor skepticism.
AI Analysis | Feedback
AI Analysis | Feedback
AgEagle Aerial Systems, Inc. (UAVS) operates in the unmanned aerial systems (UAS) market, offering drones, sensors, and software solutions for various industries. The addressable markets for its main products and services are substantial and span globally, with North America often holding a significant share.
Drones and Custom Manufacturing
- Agricultural Drones: The global agricultural drones market was estimated to be valued at approximately USD 5.86 billion in 2025 and is projected to reach about USD 23.73 billion by 2032, with a compound annual growth rate (CAGR) of 22.1% from 2025 to 2032. North America is a dominant force in this market, expected to hold 45% of the share in 2025. Another estimate places the global agricultural drones market at USD 3.37 billion in 2025, projected to reach USD 21.59 billion by 2033.
- Drones for Energy/Utilities and Infrastructure Inspection: The global inspection drone market, which includes energy, utilities, and infrastructure inspections, was valued at USD 3.37 billion in 2024 and is projected to grow from USD 3.98 billion in 2025 to USD 12.34 billion by 2032, exhibiting a CAGR of 17.6%. North America held the dominant inspection drone market share in 2023, valuing at USD 1.00 billion, and continued to lead in 2024 with USD 1.17 billion. Specifically for utility drones, the global market was valued at USD 591.57 million in 2025 and is expected to reach USD 4,579.65 million by 2032, growing at a CAGR of 34.0%. North America is anticipated to dominate the utility drones market.
Sensors
- Drone Sensors: The global drone sensors market size was estimated at USD 1.42 billion in 2023 and is projected to reach USD 2.67 billion by 2030, with a CAGR of 10.0% from 2024 to 2030. Another report estimated the market at USD 1.4 billion in 2024, growing to USD 2.5 billion by 2029. North America accounted for nearly 40% of the revenue share in the drone sensor market in 2023.
Software-as-a-Service (SaaS)
- Drone Software: The global drone software market size was estimated at USD 9.27 billion in 2024 and is projected to reach USD 24.39 billion by 2030, growing at a CAGR of 16.0% from 2025 to 2030. North America's drone software market accounted for the highest share of over 34% in 2024. The agriculture segment held the largest market share by application in 2023.
AI Analysis | Feedback
AgEagle Aerial Systems (UAVS) is expected to drive future revenue growth over the next 2-3 years through several key initiatives, focusing on strategic market expansion, technological advancements, and enhanced product offerings:
- Increased Penetration and Sales in the Global Defense and Government Sectors: AgEagle has strategically shifted its focus towards the defense and government verticals, achieving significant orders such as 49 eBee Drones for the French military and 20 UAS Drones for UAE security forces in 2024. The company is actively positioning its higher-margin eBee TAC and eBee VISION drones for the U.S. defense market, particularly benefiting from their "Blue UAS" certification, which allows them to be used by the U.S. Department of Defense. This strategic emphasis on military and public safety applications, coupled with a growing demand for unmanned aerial vehicles in national security, is anticipated to be a substantial revenue driver.
- Geographic Expansion into High-Growth International Markets: AgEagle is expanding its footprint in new international territories. A strategic alliance with Vyom Drones in India aims to license the manufacture and sale of AgEagle eBee X drones to meet the burgeoning demand in India's precision agriculture and surveying markets. This initiative targets India's agriculture drone market, projected for significant growth by 2030. Furthermore, the company has secured orders for its multispectral sensors in East Asia for specialized research and for drones in the Middle East, a region increasingly utilizing UAVs for defense and security.
- Advancements in Autonomous and AI-Powered Drone Technologies and Advanced Sensors: AgEagle is focused on enhancing its technological capabilities through strategic partnerships and product development. The company has invested in Aerodrome Group to bolster its autonomy and precision strike technologies, with a potential joint venture in the United States. Additionally, AgEagle is collaborating with an Israeli firm to demonstrate AI-enabled autonomous UAS teaming for applications like border security and surveillance, integrating AI-powered mission planning with its eBee VISION drones. The company's sensor segment has also shown strong growth, driven by demand for advanced panchromatic and multispectral sensors like the RedEdge-P and Altum-PT.
- Growth from Newer, Higher-Margin Drone Product Lines: The company is prioritizing the sales of its newer, higher-margin drone products, specifically the eBee VISION and eBee TAC. These products are tailored for defense and security missions and are seeing increased adoption. While older eBee series drone sales have declined, the strategic focus on these advanced systems is expected to rebound sales in the drone segment in future quarters, supported by comprehensive market initiatives and reseller networks.
AI Analysis | Feedback
Share Issuance
- AgEagle entered into a Securities Purchase Agreement on November 5, 2025, to issue up to 100,000 shares of Series G Convertible Preferred Stock, with an initial sale of 12,000 shares at a conversion price of $1.23 per share.
- Shareholders approved the issuance of common shares upon conversion of the 100,000 shares of Series G Convertible Preferred Stock on January 22, 2026.
- In June 2022, AgEagle completed a registered direct offering for approximately $10 million, involving the sale of 10,000 shares of Series F 5% Convertible Preferred Stock and warrants to purchase up to 10,416,667 shares of common stock.
Inbound Investments
- Institutional investors purchased approximately $2.76 million worth of AgEagle shares over the last 24 months, totaling 1,802,899 shares.
- Major institutional investors include Vanguard Group Inc. ($1.29M), UBS Group AG ($863K), DNB Asset Management AS ($726K), and Geode Capital Management LLC ($324K).
Outbound Investments
- On March 4, 2026, AgEagle made a strategic equity investment in Israel-based Aerodrome Group Ltd., purchasing 11,523,750 ordinary shares for 9,219,000 NIS (approximately $2.5 million USD).
- This investment aims to enhance AgEagle's capabilities in autonomy and precision strike technologies and bolster its presence in the autonomous defense sector.
- The agreement with Aerodrome Group Ltd. also includes a framework for a potential joint venture in the United States and Canada to distribute advanced autonomous uncrewed systems.
Capital Expenditures
- Approximately $9.92 million in net proceeds from the June 2022 registered direct offering were earmarked for general working capital and capital expenditure purposes.
- AgEagle's business involves capital-intensive technology development, underscoring the importance of equity financing to support its operations.
- The company recently moved its global headquarters to Allen, Texas, with plans to establish production lines for manufacturing MicaSense multispectral sensors and eBee VISION drones, indicating future capital expenditures for these facilities.
Latest Trefis Analyses
| Title | Date | |
|---|---|---|
| DASHBOARDS | ||
| AgEagle Aerial Systems Earnings Notes | 12/16/2025 | |
| With AgEagle Aerial Systems Stock Sliding, Have You Assessed The Risk? | 10/17/2025 |
| Title | |
|---|---|
| ARTICLES |
Research & Analysis
Invest in Strategies
Wealth Management
Peer Comparisons
| Peers to compare with: |
Financials
| Median | |
|---|---|
| Name | |
| Mkt Price | 49.00 |
| Mkt Cap | 8.0 |
| Rev LTM | 1,513 |
| Op Inc LTM | 7 |
| FCF LTM | -49 |
| FCF 3Y Avg | -29 |
| CFO LTM | -26 |
| CFO 3Y Avg | 8 |
Growth & Margins
| Median | |
|---|---|
| Name | |
| Rev Chg LTM | 14.9% |
| Rev Chg 3Y Avg | 9.6% |
| Rev Chg Q | 17.2% |
| QoQ Delta Rev Chg LTM | 3.9% |
| Op Inc Chg LTM | -31.2% |
| Op Inc Chg 3Y Avg | 8.2% |
| Op Mgn LTM | -2.0% |
| Op Mgn 3Y Avg | 2.4% |
| QoQ Delta Op Mgn LTM | 0.1% |
| CFO/Rev LTM | -6.8% |
| CFO/Rev 3Y Avg | -0.2% |
| FCF/Rev LTM | -12.3% |
| FCF/Rev 3Y Avg | -4.9% |
Segment Financials
Revenue by Segment| $ Mil | 2025 | 2024 | 2023 | 2022 | 2021 |
|---|---|---|---|---|---|
| Drones | 8 | 6 | 6 | 10 | 2 |
| Sensors | 5 | 7 | 7 | 9 | 7 |
| Corporate | 0 | 0 | 0 | ||
| Software-as-a-Service (SaaS) | 0 | 0 | 0 | 1 | 1 |
| Total | 13 | 13 | 14 | 19 | 10 |
| $ Mil | 2025 | 2024 | 2023 | 2022 | 2021 |
|---|---|---|---|---|---|
| Software-as-a-Service (SaaS) | -0 | -1 | -7 | -32 | -15 |
| Drones | -4 | -5 | -9 | -22 | -2 |
| Corporate | -4 | -4 | -7 | -10 | -12 |
| Sensors | -7 | -2 | -15 | 0 | -1 |
| Total | -15 | -13 | -39 | -64 | -30 |
| $ Mil | 2025 | 2024 | 2023 | 2022 | 2021 |
|---|---|---|---|---|---|
| Corporate | 5 | -26 | -9 | -4 | -12 |
| Software-as-a-Service (SaaS) | -0 | -1 | -7 | -32 | -15 |
| Drones | -4 | -5 | -9 | -22 | -2 |
| Sensors | -6 | -2 | -16 | -0 | -1 |
| Total | -5 | -35 | -42 | -58 | -30 |
| $ Mil | 2025 | 2024 | 2023 | 2022 | 2021 |
|---|---|---|---|---|---|
| Corporate | 30 | 4 | 1 | 5 | 15 |
| Drones | 9 | 7 | 9 | 15 | 27 |
| Sensors | 3 | 10 | 15 | 26 | 26 |
| Software-as-a-Service (SaaS) | 0 | 0 | 0 | 8 | 38 |
| Total | 42 | 21 | 25 | 54 | 105 |
Price Behavior
| Market Price | $0.72 | |
| Market Cap ($ Bil) | 0.0 | |
| First Trading Date | 03/23/2007 | |
| Distance from 52W High | -76.0% | |
| 50 Days | 200 Days | |
| DMA Price | $0.94 | $1.25 |
| DMA Trend | down | down |
| Distance from DMA | -23.5% | -42.7% |
| 3M | 1YR | |
| Volatility | 62.9% | 122.0% |
| Downside Capture | 488.59 | 461.50 |
| Upside Capture | 142.81 | 240.52 |
| Correlation (SPY) | 50.7% | 32.0% |
| 1M | 2M | 3M | 6M | 1Y | 3Y | |
|---|---|---|---|---|---|---|
| Beta | 1.78 | 2.25 | 2.22 | 2.28 | 2.99 | 1.70 |
| Up Beta | 1.69 | 1.65 | 1.42 | 0.53 | 2.19 | 1.49 |
| Down Beta | 2.24 | 2.08 | 2.07 | 3.30 | 3.63 | 1.50 |
| Up Capture | 14% | 168% | 218% | 328% | 573% | 28% |
| Bmk +ve Days | 11 | 24 | 40 | 67 | 140 | 429 |
| Stock +ve Days | 7 | 17 | 31 | 54 | 111 | 314 |
| Down Capture | 270% | 296% | 318% | 209% | 189% | 113% |
| Bmk -ve Days | 10 | 17 | 23 | 58 | 112 | 321 |
| Stock -ve Days | 14 | 22 | 30 | 65 | 130 | 413 |
[1] Upside and downside betas calculated using positive and negative benchmark daily returns respectively
Based On 1-Year Data
| Annualized Return | Annualized Volatility | Sharpe Ratio | Correlation with UAVS | |
|---|---|---|---|---|
| UAVS | -63.2% | 122.2% | -0.30 | - |
| Sector ETF (XLK) | 38.8% | 24.7% | 1.27 | 27.2% |
| Equity (SPY) | 20.0% | 12.6% | 1.16 | 32.1% |
| Gold (GLD) | 21.2% | 28.1% | 0.67 | 18.8% |
| Commodities (DBC) | 33.0% | 19.1% | 1.36 | 7.2% |
| Real Estate (VNQ) | 13.9% | 14.0% | 0.70 | 12.8% |
| Bitcoin (BTCUSD) | -43.6% | 42.9% | -1.21 | 32.4% |
Smart multi-asset allocation framework can stack odds in your favor. Learn How
Based On 5-Year Data
| Annualized Return | Annualized Volatility | Sharpe Ratio | Correlation with UAVS | |
|---|---|---|---|---|
| UAVS | -80.3% | 137.8% | -0.59 | - |
| Sector ETF (XLK) | 19.6% | 25.6% | 0.68 | 20.3% |
| Equity (SPY) | 12.8% | 17.1% | 0.58 | 22.0% |
| Gold (GLD) | 17.3% | 18.4% | 0.76 | 10.1% |
| Commodities (DBC) | 9.3% | 19.5% | 0.37 | 9.5% |
| Real Estate (VNQ) | 2.7% | 18.9% | 0.04 | 16.9% |
| Bitcoin (BTCUSD) | 15.2% | 53.5% | 0.46 | 14.4% |
Smart multi-asset allocation framework can stack odds in your favor. Learn How
Based On 10-Year Data
| Annualized Return | Annualized Volatility | Sharpe Ratio | Correlation with UAVS | |
|---|---|---|---|---|
| UAVS | -57.4% | 160.5% | 0.08 | - |
| Sector ETF (XLK) | 24.5% | 24.8% | 0.89 | 13.7% |
| Equity (SPY) | 15.1% | 17.9% | 0.72 | 14.2% |
| Gold (GLD) | 11.5% | 16.1% | 0.58 | 6.2% |
| Commodities (DBC) | 7.1% | 17.9% | 0.31 | 7.8% |
| Real Estate (VNQ) | 5.0% | 20.7% | 0.20 | 8.7% |
| Bitcoin (BTCUSD) | 58.5% | 66.2% | 0.99 | 6.6% |
Smart multi-asset allocation framework can stack odds in your favor. Learn How
Returns Analyses
Earnings Returns History
Updated 6/18/2026| Forward Returns | |||
|---|---|---|---|
| Earnings Date | 1D Returns | 5D Returns | 21D Returns |
| 11/17/2025 | -8.1% | -4.8% | -24.9% |
| 8/16/2021 | -1.3% | -17.3% | -14.4% |
| SUMMARY STATS | |||
| # Positive | 0 | 0 | 0 |
| # Negative | 2 | 2 | 2 |
| Median Positive | |||
| Median Negative | -4.7% | -11.1% | -19.7% |
| Max Positive | |||
| Max Negative | -8.1% | -17.3% | -24.9% |
| Forward Returns | |||
|---|---|---|---|
| Earnings Date | 1D Returns | 5D Returns | 21D Returns |
| 11/17/2025 | -8.1% | -4.8% | -24.9% |
| 8/16/2021 | -1.3% | -17.3% | -14.4% |
| SUMMARY STATS | |||
| # Positive | 0 | 0 | 0 |
| # Negative | 2 | 2 | 2 |
| Median Positive | |||
| Median Negative | -4.7% | -11.1% | -19.7% |
| Max Positive | |||
| Max Negative | -8.1% | -17.3% | -24.9% |
SEC Filings
Expand for More| Report Date | Filing Date | Filing |
|---|---|---|
| 03/31/2026 | 05/15/2026 | 10-Q |
| 12/31/2025 | 03/31/2026 | 10-K |
| 09/30/2025 | 11/14/2025 | 10-Q |
| 06/30/2025 | 08/14/2025 | 10-Q |
| 03/31/2025 | 05/15/2025 | 10-Q |
| 12/31/2024 | 03/31/2025 | 10-K |
| 09/30/2024 | 11/19/2024 | 10-Q |
| 06/30/2024 | 08/14/2024 | 10-Q |
| 03/31/2024 | 05/15/2024 | 10-Q |
| 12/31/2023 | 04/01/2024 | 10-K |
| 09/30/2023 | 11/13/2023 | 10-Q |
| 06/30/2023 | 08/14/2023 | 10-Q |
| 03/31/2023 | 05/15/2023 | 10-Q |
| 12/31/2022 | 04/04/2023 | 10-K |
| 09/30/2022 | 11/14/2022 | 10-Q |
| 06/30/2022 | 08/15/2022 | 10-Q |
| Report Date | Filing Date | Filing |
|---|---|---|
| 03/31/2026 | 05/15/2026 | 10-Q |
| 12/31/2025 | 03/31/2026 | 10-K |
| 09/30/2025 | 11/14/2025 | 10-Q |
| 06/30/2025 | 08/14/2025 | 10-Q |
| 03/31/2025 | 05/15/2025 | 10-Q |
| 12/31/2024 | 03/31/2025 | 10-K |
| 09/30/2024 | 11/19/2024 | 10-Q |
| 06/30/2024 | 08/14/2024 | 10-Q |
| 03/31/2024 | 05/15/2024 | 10-Q |
| 12/31/2023 | 04/01/2024 | 10-K |
| 09/30/2023 | 11/13/2023 | 10-Q |
| 06/30/2023 | 08/14/2023 | 10-Q |
| 03/31/2023 | 05/15/2023 | 10-Q |
| 12/31/2022 | 04/04/2023 | 10-K |
| 09/30/2022 | 11/14/2022 | 10-Q |
| 06/30/2022 | 08/15/2022 | 10-Q |
| 03/31/2022 | 05/16/2022 | 10-Q |
| 12/31/2021 | 04/12/2022 | 10-K |
| 09/30/2021 | 11/12/2021 | 10-Q |
| 06/30/2021 | 08/18/2021 | 10-Q |
| 03/31/2021 | 05/17/2021 | 10-Q |
| 12/31/2020 | 03/31/2021 | 10-K |
| 09/30/2020 | 11/13/2020 | 10-Q |
| 06/30/2020 | 08/14/2020 | 10-Q |
| 03/31/2020 | 05/14/2020 | 10-Q |
| 12/31/2019 | 04/13/2020 | 10-K |
| 09/30/2019 | 11/14/2019 | 10-Q |
| 06/30/2019 | 08/13/2019 | 10-Q |
Insider Activity
Updated 6/8/2026| # | Owner | Title | Holding | Action | Filing Date | Price | Shares | Transacted Value | Value of Held Shares | Form |
|---|---|---|---|---|---|---|---|---|---|---|
| 1 | Begley, Grant A | Chairman of the Board | Direct | Sell | 9042025 | 1.86 | 70 | 130 | 55,303 | Form |
| # | Owner | Title | Holding | Action | Filing Date | Price | Shares | Transacted Value | Value of Held Shares | Form |
|---|---|---|---|---|---|---|---|---|---|---|
| 1 | Begley, Grant A | Chairman of the Board | Direct | Sell | 9042025 | 1.86 | 70 | 130 | 55,303 | Form |


Industry Resources
| Information Technology Resources |
| TechCrunch |
| Wired |
| CIO |
| MIT Technology Review |
| Gartner Insights |
| Ars Technica |
| Technology Hardware, Storage & Peripherals Resources |
| The Verge |
| TechRadar |
| Tom’s Hardware |
| PCMag |
| CNET |
External Quote Links
| Y Finance | Barrons |
| TradingView | Morningstar |
| SeekingAlpha | ValueLine |
| Motley Fool | Robinhood |
| CNBC | Etrade |
| MarketWatch | Unusual Whales |
| YCharts | Perplexity Finance |
| FinViz |
Prefer one of these to Trefis? Tell us why.