
Caterpillar (CAT)
Market Price (7/16/2026): $886.01 | Market Cap: $410.6 BilInvestor Relations Sector: Industrials | Industry: Construction Machinery & Heavy Transportation Equipment
Caterpillar (CAT)
Market Price (7/16/2026): $886.01Market Cap: $410.6 BilSector: IndustrialsIndustry: Construction Machinery & Heavy Transportation Equipment
Investment Highlights Why It Matters Detailed financial logic regarding cash flow yields vs trend-riding momentum.
Attractive cash flow generationCFO/Rev LTMCash Flow from Operations / Revenue (Sales), Last Twelve Months (LTM) is 17%, FCF/Rev LTMFree Cash Flow / Revenue (Sales), Last Twelve Months (LTM) is 11%, CFO LTM is 12 Bil, FCF LTM is 7.9 Bil Stock buyback supportStock Buyback 3Y Total is 23 Bil Low stock price volatilityVol 12M is 38% Megatrend and thematic driversMegatrends include Automation & Robotics, Future of Freight, Sustainable Infrastructure, Hydrogen Economy, Show more. | Expensive valuation multiplesP/EBITPrice/EBIT or Price/(Operating Income) ratio is 33x, P/CFOPrice/(Cash Flow from Operations). CFO is cash before capital expenditures. is 34x Stock price has recently run up significantly12M Rtn12 month market price return is 128% Valuation getting more expensiveP/S 6M Chg %Price/Sales change over 6 months. Declining P/S indicates valuation has become less expensive. is 52% Key risksCAT key risks include [1] a high vulnerability to cyclical downturns and shifts in U.S. Show more. |
| Attractive cash flow generationCFO/Rev LTMCash Flow from Operations / Revenue (Sales), Last Twelve Months (LTM) is 17%, FCF/Rev LTMFree Cash Flow / Revenue (Sales), Last Twelve Months (LTM) is 11%, CFO LTM is 12 Bil, FCF LTM is 7.9 Bil |
| Stock buyback supportStock Buyback 3Y Total is 23 Bil |
| Low stock price volatilityVol 12M is 38% |
| Megatrend and thematic driversMegatrends include Automation & Robotics, Future of Freight, Sustainable Infrastructure, Hydrogen Economy, Show more. |
| Expensive valuation multiplesP/EBITPrice/EBIT or Price/(Operating Income) ratio is 33x, P/CFOPrice/(Cash Flow from Operations). CFO is cash before capital expenditures. is 34x |
| Stock price has recently run up significantly12M Rtn12 month market price return is 128% |
| Valuation getting more expensiveP/S 6M Chg %Price/Sales change over 6 months. Declining P/S indicates valuation has become less expensive. is 52% |
| Key risksCAT key risks include [1] a high vulnerability to cyclical downturns and shifts in U.S. Show more. |
Qualitative Assessment
AI Analysis | Feedback
Caterpillar (CAT) stock has gained about 30% since 3/31/2026 because of the following key factors:
1. Strong Fiscal Q1 2026 Performance and Upbeat Full-Year Guidance. Caterpillar reported robust financial results for fiscal Q1 2026 on April 30, 2026, exceeding market expectations. The company announced earnings per share (EPS) of $5.54, significantly beating the consensus estimate of $4.62 by 19.91%. Additionally, revenue grew by 22.2% year-over-year to $17.41 billion, surpassing analyst estimates of $16.53 billion. Following this strong performance, Caterpillar raised its full-year 2026 outlook, projecting low-double-digit sales and revenue growth.
2. Record Backlog and Sustained Demand Driven by Infrastructure and AI Buildout. The company reported a record backlog of $63 billion at the end of fiscal Q1 2026, marking a 79% increase compared to fiscal Q1 2025 and indicating strong future revenue visibility. This demand is broad-based, with all three primary segments contributing to growth. A significant driver is the increasing capital expenditure in AI infrastructure, benefiting Caterpillar's Power & Energy segment through demand for large reciprocating engines and turbines, with lead times extending into 2029.
Show more
Caterpillar (CAT) stock has gained about 30% since 3/31/2026 because of the following key factors:
1. Strong Fiscal Q1 2026 Performance and Upbeat Full-Year Guidance. Caterpillar reported robust financial results for fiscal Q1 2026 on April 30, 2026, exceeding market expectations. The company announced earnings per share (EPS) of $5.54, significantly beating the consensus estimate of $4.62 by 19.91%. Additionally, revenue grew by 22.2% year-over-year to $17.41 billion, surpassing analyst estimates of $16.53 billion. Following this strong performance, Caterpillar raised its full-year 2026 outlook, projecting low-double-digit sales and revenue growth.
2. Record Backlog and Sustained Demand Driven by Infrastructure and AI Buildout. The company reported a record backlog of $63 billion at the end of fiscal Q1 2026, marking a 79% increase compared to fiscal Q1 2025 and indicating strong future revenue visibility. This demand is broad-based, with all three primary segments contributing to growth. A significant driver is the increasing capital expenditure in AI infrastructure, benefiting Caterpillar's Power & Energy segment through demand for large reciprocating engines and turbines, with lead times extending into 2029.
3. Positive Analyst Revisions and Increased Price Targets. Post fiscal Q1 2026 earnings, multiple investment analysts revised their ratings and price targets for Caterpillar upwards. For instance, on July 2, 2026, Truist Securities raised its price target to $1,218 from $1,043, maintaining a "Buy" rating. Wells Fargo also increased its price target to $1,155 from $1,050 on June 23, 2026, while Citigroup boosted its objective from $905.00 to $1,020.00 in May 2026. The overall consensus rating for Caterpillar remains a "Moderate Buy," with an average price target of $1,002.88.
4. Enhanced Shareholder Returns and Favorable Tariff Revisions. Caterpillar demonstrated confidence in its financial position by increasing its quarterly dividend by 8% to $1.63 per share, payable on August 19, 2026. Furthermore, the company experienced a more favorable impact from tariffs in fiscal Q1 2026, with related costs amounting to approximately $600 million, which was below the prior estimate of $800 million. The full-year 2026 tariff cost estimate was also revised down from $2.6 billion to $2.2–$2.4 billion, reducing a significant headwind.
Show less
Stock Movement Drivers
Fundamental Drivers
The 29.3% change in CAT stock from 3/31/2026 to 7/15/2026 was primarily driven by a 21.1% change in the company's P/E Multiple.| (LTM values as of) | 3312026 | 7152026 | Change |
|---|---|---|---|
| Stock Price ($) | 707.11 | 914.30 | 29.3% |
| Change Contribution By: | |||
| Total Revenues ($ Mil) | 67,589 | 70,755 | 4.7% |
| Net Income Margin (%) | 13.1% | 13.3% | 1.4% |
| P/E Multiple | 37.1 | 44.9 | 21.1% |
| Shares Outstanding (Mil) | 466 | 463 | 0.6% |
| Cumulative Contribution | 29.3% |
Market Drivers
3/31/2026 to 7/15/2026| Return | Correlation | |
|---|---|---|
| CAT | 29.3% | |
| Market (SPY) | 16.1% | 56.5% |
| Sector (XLI) | 11.3% | 83.8% |
Fundamental Drivers
The 60.3% change in CAT stock from 12/31/2025 to 7/15/2026 was primarily driven by a 55.9% change in the company's P/E Multiple.| (LTM values as of) | 12312025 | 7152026 | Change |
|---|---|---|---|
| Stock Price ($) | 570.45 | 914.30 | 60.3% |
| Change Contribution By: | |||
| Total Revenues ($ Mil) | 64,671 | 70,755 | 9.4% |
| Net Income Margin (%) | 14.3% | 13.3% | -7.1% |
| P/E Multiple | 28.8 | 44.9 | 55.9% |
| Shares Outstanding (Mil) | 469 | 463 | 1.1% |
| Cumulative Contribution | 60.3% |
Market Drivers
12/31/2025 to 7/15/2026| Return | Correlation | |
|---|---|---|
| CAT | 60.3% | |
| Market (SPY) | 11.0% | 59.7% |
| Sector (XLI) | 16.4% | 83.1% |
Fundamental Drivers
The 138.1% change in CAT stock from 6/30/2025 to 7/15/2026 was primarily driven by a 144.8% change in the company's P/E Multiple.| (LTM values as of) | 6302025 | 7152026 | Change |
|---|---|---|---|
| Stock Price ($) | 384.05 | 914.30 | 138.1% |
| Change Contribution By: | |||
| Total Revenues ($ Mil) | 63,259 | 70,755 | 11.8% |
| Net Income Margin (%) | 15.7% | 13.3% | -15.2% |
| P/E Multiple | 18.4 | 44.9 | 144.8% |
| Shares Outstanding (Mil) | 475 | 463 | 2.5% |
| Cumulative Contribution | 138.1% |
Market Drivers
6/30/2025 to 7/15/2026| Return | Correlation | |
|---|---|---|
| CAT | 138.1% | |
| Market (SPY) | 23.2% | 56.1% |
| Sector (XLI) | 23.3% | 75.8% |
Fundamental Drivers
The 288.8% change in CAT stock from 6/30/2023 to 7/15/2026 was primarily driven by a 163.2% change in the company's P/E Multiple.| (LTM values as of) | 6302023 | 7152026 | Change |
|---|---|---|---|
| Stock Price ($) | 235.17 | 914.30 | 288.8% |
| Change Contribution By: | |||
| Total Revenues ($ Mil) | 61,700 | 70,755 | 14.7% |
| Net Income Margin (%) | 11.5% | 13.3% | 15.6% |
| P/E Multiple | 17.1 | 44.9 | 163.2% |
| Shares Outstanding (Mil) | 516 | 463 | 11.4% |
| Cumulative Contribution | 288.8% |
Market Drivers
6/30/2023 to 7/15/2026| Return | Correlation | |
|---|---|---|
| CAT | 288.8% | |
| Market (SPY) | 76.3% | 60.4% |
| Sector (XLI) | 74.8% | 75.3% |
Price Returns Compared
| 2021 | 2022 | 2023 | 2024 | 2025 | 2026 | Total [1] | |
|---|---|---|---|---|---|---|---|
| Returns | |||||||
| CAT Return | 16% | 19% | 26% | 25% | 60% | 64% | 466% |
| Peers Return | 19% | 7% | 22% | 8% | 24% | 23% | 155% |
| S&P 500 Return | 27% | -19% | 24% | 23% | 16% | 10% | 101% |
Monthly Win Rates [3] | |||||||
| CAT Win Rate | 58% | 50% | 50% | 67% | 50% | 57% | |
| Peers Win Rate | 62% | 43% | 48% | 53% | 65% | 60% | |
| S&P 500 Win Rate | 75% | 42% | 67% | 75% | 67% | 57% | |
Max Drawdowns [4] | |||||||
| CAT Max Drawdown | -22% | -30% | -22% | -16% | -33% | -14% | |
| Peers Max Drawdown | -23% | -31% | -23% | -22% | -28% | -21% | |
| S&P 500 Max Drawdown | -5% | -25% | -10% | -8% | -19% | -9% | |
[1] Cumulative total returns since the beginning of 2021
[2] Peers: DE, PCAR, CMI, TEX, OSK. See CAT Returns vs. Peers.
[3] Win Rate = % of calendar months in which monthly returns were positive
[4] Max drawdown represents maximum peak-to-trough decline within a year
[5] 2026 data is for the year up to 7/15/2026 (YTD)
How Low Can It Go
| Event | CAT | S&P 500 |
|---|---|---|
| 2025 US Tariff Shock | ||
| % Loss | -22.4% | -18.8% |
| % Gain to Breakeven | 28.9% | 23.1% |
| Time to Breakeven | 35 days | 79 days |
| Summer-Fall 2023 Five Percent Yield Shock | ||
| % Loss | -13.3% | -9.5% |
| % Gain to Breakeven | 15.3% | 10.5% |
| Time to Breakeven | 41 days | 24 days |
| 2023 SVB Regional Banking Crisis | ||
| % Loss | -16.6% | -6.7% |
| % Gain to Breakeven | 20.0% | 7.1% |
| Time to Breakeven | 15 days | 31 days |
| 2022 Inflation Shock & Fed Tightening | ||
| % Loss | -20.2% | -24.5% |
| % Gain to Breakeven | 25.3% | 32.4% |
| Time to Breakeven | 30 days | 427 days |
| 2020 COVID-19 Crash | ||
| % Loss | -32.9% | -33.7% |
| % Gain to Breakeven | 49.0% | 50.9% |
| Time to Breakeven | 77 days | 140 days |
| Q4 2018 Fed Policy Error / Growth Scare | ||
| % Loss | -28.5% | -19.2% |
| % Gain to Breakeven | 39.9% | 23.8% |
| Time to Breakeven | 686 days | 105 days |
In The Past
Caterpillar's stock fell -22.4% during the 2025 US Tariff Shock. Such a loss loss requires a 28.9% gain to breakeven.
Preserve Wealth
Limiting losses and compounding gains is essential to preserving wealth.
Asset Allocation
Actively managed asset allocation strategies protect wealth. Learn more.
| Event | CAT | S&P 500 |
|---|---|---|
| 2025 US Tariff Shock | ||
| % Loss | -22.4% | -18.8% |
| % Gain to Breakeven | 28.9% | 23.1% |
| Time to Breakeven | 35 days | 79 days |
| 2022 Inflation Shock & Fed Tightening | ||
| % Loss | -20.2% | -24.5% |
| % Gain to Breakeven | 25.3% | 32.4% |
| Time to Breakeven | 30 days | 427 days |
| 2020 COVID-19 Crash | ||
| % Loss | -32.9% | -33.7% |
| % Gain to Breakeven | 49.0% | 50.9% |
| Time to Breakeven | 77 days | 140 days |
| Q4 2018 Fed Policy Error / Growth Scare | ||
| % Loss | -28.5% | -19.2% |
| % Gain to Breakeven | 39.9% | 23.8% |
| Time to Breakeven | 686 days | 105 days |
| 2015-2016 China Devaluation / Global Growth Scare | ||
| % Loss | -24.5% | -12.2% |
| % Gain to Breakeven | 32.5% | 13.9% |
| Time to Breakeven | 67 days | 62 days |
| 2014-2016 Oil Price Collapse | ||
| % Loss | -43.8% | -6.8% |
| % Gain to Breakeven | 78.0% | 7.3% |
| Time to Breakeven | 456 days | 15 days |
| 2011 US Debt Ceiling Crisis & European Contagion | ||
| % Loss | -32.9% | -17.9% |
| % Gain to Breakeven | 49.0% | 21.8% |
| Time to Breakeven | 107 days | 123 days |
| 2010 Eurozone Sovereign Debt Crisis / Flash Crash | ||
| % Loss | -22.1% | -15.4% |
| % Gain to Breakeven | 28.3% | 18.2% |
| Time to Breakeven | 59 days | 125 days |
| 2008-2009 Global Financial Crisis | ||
| % Loss | -68.8% | -53.4% |
| % Gain to Breakeven | 220.3% | 114.4% |
| Time to Breakeven | 417 days | 1085 days |
In The Past
Caterpillar's stock fell -22.4% during the 2025 US Tariff Shock. Such a loss loss requires a 28.9% gain to breakeven.
Preserve Wealth
Limiting losses and compounding gains is essential to preserving wealth.
Asset Allocation
Actively managed asset allocation strategies protect wealth. Learn more.
About Caterpillar (CAT)
Caterpillar Inc. (CAT) is a global leader in manufacturing and selling heavy machinery, engines, and industrial gas turbines. The company primarily operates across vital sectors such as construction, mining, and energy, providing the foundational equipment and power solutions necessary for large-scale infrastructure development, resource extraction, and power generation worldwide.
The company's core product offerings are diverse, spanning multiple segments. Its Construction Industries division provides a wide range of equipment including excavators, loaders, motor graders, and track-type tractors used in building roads, infrastructure, and general construction. The Resource Industries segment focuses on machinery for mining and quarrying, such as electric rope shovels, large mining trucks, and rotary drills, alongside advanced fleet management and autonomous solutions. Furthermore, the Energy & Transportation segment supplies critical power generation solutions, including reciprocating engines, generator sets, industrial gas turbines, and diesel-electric locomotives for marine, oil and gas, and electric power sectors.
Caterpillar serves a broad international customer base, including construction companies, mining operators, and enterprises in the oil and gas, marine, and power generation industries. Beyond equipment sales, the company also provides essential financial products, such as operating and finance leases, installment sale contracts, and wholesale financing, to support its customers in acquiring and utilizing its machinery and services. Additionally, it offers aftermarket parts like filters and undercarriage components, ensuring ongoing support and operational efficiency for its global clientele.
AI Analysis | Feedback
1. John Deere for industrial construction and mining equipment.
2. The General Motors of bulldozers and excavators.
AI Analysis | Feedback
- Construction Equipment: Manufactures and sells a wide range of machinery for construction, including excavators, loaders, and dozers.
- Mining Equipment: Provides specialized heavy machinery for mining operations, such as shovels, drills, and large mining trucks, along with support solutions.
- Engines, Turbines, and Power Systems: Offers reciprocating engines, industrial gas turbines, generator sets, and integrated systems for various industrial and power generation applications.
- Locomotives and Rail Services: Provides diesel-electric locomotives, rail components, and related services for the global railway industry.
- Financial Services: Offers operating and finance leases, installment sale contracts, working capital loans, and insurance products to customers.
- Aftermarket Parts and Components: Manufactures and sells essential parts and consumables like filters, fluids, undercarriage, and ground engaging tools for its machinery.
AI Analysis | Feedback
Caterpillar Inc. (CAT) primarily sells to other companies rather than individuals. Its major customers fall into the following categories:
- Construction Companies: These include companies involved in large-scale infrastructure projects, residential and commercial construction, road building, and site preparation, which utilize Caterpillar's wide range of construction equipment like excavators, loaders, dozers, and pavers.
- Mining Companies: Enterprises engaged in surface and underground mining operations for various minerals and resources are major customers, relying on Caterpillar's extensive line of mining trucks, shovels, drills, and other heavy equipment designed for resource extraction.
- Energy and Transportation Companies: This category encompasses businesses in sectors such as electric power generation, oil and gas exploration and production, marine transportation, and rail industries, which purchase Caterpillar's engines, generator sets, industrial gas turbines, and locomotives.
AI Analysis | Feedback
AI Analysis | Feedback
Joseph E. Creed, Chief Executive Officer
Joseph E. Creed became Chief Executive Officer of Caterpillar Inc. on May 1, 2025, and will assume the role of Chairman of the Board of Directors effective April 1, 2026. He joined Caterpillar in 1997 and has held various positions of increasing responsibility, including Chief Financial Officer for Caterpillar's Energy & Transportation segment in 2013, Senior Vice President of Caterpillar Finance Services in 2017, and interim Chief Financial Officer in 2018. He was promoted to Group President of Energy & Transportation in 2021 and named Chief Operating Officer in 2023. Mr. Creed graduated from Western Illinois University with a bachelor's degree in accounting.
Andrew Bonfield, Chief Financial Officer
Andrew Bonfield was appointed Chief Financial Officer of Caterpillar Inc. in September 2018. He brings more than three decades of financial expertise to the role. Prior to joining Caterpillar, Mr. Bonfield served as Group CFO and board member of National Grid plc, CFO at Cadbury plc, and Executive Vice President and CFO at Bristol Myers Squibb. He also held roles as finance director of BG Group plc and CFO of Smithkline Beecham plc. Mr. Bonfield is a chartered accountant and holds a Bachelor of Commerce degree from the University of Natal in Durban, South Africa. He also serves as a non-executive director and chairman of the audit committee at Reckitt Benckiser Group plc. Mr. Bonfield was the first CFO appointed from outside Caterpillar.
George A. Moubayed, Chief Sustainability and Strategy Officer and Senior Vice President
George Moubayed is the Chief Sustainability and Strategy Officer and a Senior Vice President of Caterpillar Inc., responsible for the Enterprise Strategy Division. He oversees the execution of Caterpillar's strategy for long-term profitable growth. Mr. Moubayed joined Caterpillar in 1997 and has held several leadership positions, including Vice President and General Manager for load and haul products in Resource Industries, and Vice President of Aftermarket Solutions in Resource Industries. He has a bachelor's degree in engineering from McGill University in Montreal, Canada.
David (Dave) T. Walton, President and Chief Executive Officer of Caterpillar Financial Services Corporation and Senior Vice President
David T. Walton is the President and Chief Executive Officer of Caterpillar Financial Services Corporation (Cat Financial) and a Senior Vice President of Caterpillar Inc. He is responsible for the Financial Products Division, which includes Cat Financial and Cat Financial Insurance Services. Mr. Walton joined Cat Financial in 1989 and has held various credit, portfolio management, and sales positions in the United States. His international experience includes serving as managing director of Northern Europe and vice president for Asia-Pacific operations. He also formed and led Cat Financial's global mining finance organization. Mr. Walton holds a bachelor's degree in accounting from Indiana University and a master's degree in business administration from Keller Graduate School.
Ogi Redzic, Chief Digital Officer and Senior Vice President
Ogi Redzic is the Chief Digital Officer and a Senior Vice President of Caterpillar Inc., responsible for Cat Digital. He manages key components of the company's digital and marketing portfolios, including global marketing & brand, connectivity, enterprise data, analytics and AI, and eCommerce. Before joining Caterpillar in 2018, Mr. Redzic was the Alliance Senior Vice President of Connected Vehicles and Mobility Services at Renault-Nissan Alliance. He has more than 20 years of experience in leadership positions in corporate and start-up environments, including roles at Mitsubishi, Nokia HERE, NAVTEQ, PCTEL, Inc., cyberPIXIE, and Motorola. Mr. Redzic holds a bachelor's degree in computer science from Northeastern Illinois University, a master's degree in computer science from the Illinois Institute of Technology, and an MBA from the Kellogg School of Management at Northwestern University.
AI Analysis | Feedback
Here are the key risks to Caterpillar Inc.'s business:
- Trade Policy and Tariffs: Caterpillar faces significant financial headwinds due to persistent trade policies and tariffs, leading to substantial costs and compressing operating margins. For instance, the company adjusted its tariff guidance to an estimated impact of between $1.60 billion and $1.75 billion for the full 2025 fiscal year. These costs are projected to remain substantial, with an estimated incremental cost of $2.6 billion in 2026, directly impacting operating margins and segment profits.
- Cyclical Demand and Macroeconomic Vulnerability: Caterpillar's core business, heavily reliant on the construction and mining sectors, is exposed to the cyclical nature of these industries. Revenue and profitability are susceptible to economic downturns, fluctuations in commodity prices, project funding, and overall macroeconomic conditions. This vulnerability can lead to rapid declines in equipment purchases and sales volumes, exacerbated by risks of dealer inventory destocking.
- Intensifying Competitive Pressure: The company faces aggressive competition, particularly in the North American construction market. Competitors, especially from China, have the advantage of lower labor costs and better access to raw materials and components, which can lead to market share loss and negatively impact Caterpillar's pricing power and profitability. Deere & Company and Komatsu are actively strengthening their presence in key markets, indicating escalating competitive challenges.
AI Analysis | Feedback
There are two clear emerging threats for Caterpillar:
- Rapid Electrification of Heavy Equipment: A significant industry shift towards battery-electric and hydrogen-powered machinery, particularly in construction and mining. While Caterpillar is investing in these technologies, the swift pace of adoption, driven by environmental regulations, sustainability goals, and operating cost benefits, could disrupt its dominant position in diesel-powered equipment. Agile new entrants or existing competitors fully committing to electric fleets could gain market share rapidly, challenging Caterpillar's traditional product lines and potentially cannibalizing its legacy engine and equipment sales faster than its new electric offerings can compensate.
- Decarbonization and Shift Away from Fossil Fuels in Energy & Transportation: The global push for cleaner energy solutions, including renewable power generation (solar, wind) and advanced energy storage, poses a direct threat to Caterpillar's Energy & Transportation segment. This segment heavily relies on manufacturing and selling diesel and natural gas engines and generator sets. As industries, marine, and power generation sectors increasingly transition to alternative fuels (e.g., hydrogen) or completely bypass internal combustion engines in favor of electric grids powered by renewables, the demand for Caterpillar's traditional fossil fuel-based power solutions could decline significantly.
AI Analysis | Feedback
Caterpillar (CAT) operates in several significant global markets for its main products and services.
Construction Equipment
The global construction equipment market size was valued at approximately USD 242.17 billion in 2025 and is projected to reach USD 471.25 billion by 2033, demonstrating a Compound Annual Growth Rate (CAGR) of 8.7% from 2026 to 2033. Asia Pacific is noted as the dominant region in this market, holding a substantial share of the global revenue in 2025.
Mining Equipment
The global mining equipment market size was estimated at USD 95.97 billion in 2024 and is anticipated to grow to USD 150.11 billion by 2032, at a CAGR of 5.75% over the forecast period. Asia-Pacific leads the global mining equipment market, driven by significant mining activities, rapid industrialization, and large-scale infrastructure development projects in countries like China, India, and Australia.
Diesel and Natural Gas Engines
The global diesel engine market size reached USD 243.8 billion in 2025 and is expected to grow to USD 318.7 billion by 2034, with a CAGR of 3.02% during the period of 2026-2034. For diesel engines specifically used for power generation, the global market size was valued at USD 49.9 billion in 2025 and is projected to reach USD 93.1 billion by 2033, expanding at a CAGR of 8.2% from 2026 to 2033. Asia Pacific held the largest share of the diesel engine for power generation market in 2025.
Industrial Gas Turbines
The global industrial gas turbine market size was USD 9.55 billion in 2025 and is expected to increase from USD 9.85 billion in 2026 to USD 12.16 billion by 2034, at a CAGR of 2.67%. Another estimate places the global industrial gas turbine market at USD 7.3 billion in 2024, projected to grow to USD 12.2 billion in 2034 with a CAGR of 5.1% from 2025 to 2034. Asia-Pacific accounted for 45.60% of the global revenue in 2025.
Locomotives and Rail-related Products
The global locomotive market size was valued at USD 14.42 billion in 2025 and is projected to grow to USD 31.25 billion by 2034, exhibiting a CAGR of 9.43% from 2026 to 2034. Asia Pacific dominated the global locomotive market with a share of 52.63% in 2025.
AI Analysis | Feedback
Caterpillar Inc. (CAT) is expected to drive future revenue growth over the next 2-3 years through several key factors:
- Strong Backlog and Volume Growth: Caterpillar holds a record backlog of $51 billion, a significant portion of which is anticipated to be delivered within the next 12 months, providing substantial momentum and expected volume growth across all primary business segments.
- Increased Demand for Power Generation: The Energy & Transportation segment is poised for robust growth, particularly from rising energy demands for data centers and hyperscalers supporting cloud computing and generative AI. The company has secured large orders for generator sets for data center prime power, with deliveries scheduled through 2027.
- Growth in Services Revenue: Caterpillar is strategically accelerating its services revenue, targeting an annual figure of $28 billion by 2026. This growth is driven by repower programs, equipment upgrades, and long-term maintenance contracts, capitalizing on the company's extensive global dealer network and connected assets.
- Positive Price Realization: Caterpillar projects positive price realization, with approximately 2% favorable price adjustments contributing to sales growth across all three primary segments in 2026.
- Infrastructure Investment and Reshoring: The Construction Industries segment is expected to benefit from infrastructure tailwinds, including government funding (such as IIGJA funding), accelerated investment in data center construction, and reshoring initiatives in U.S. manufacturing, all of which are driving demand for construction equipment.
AI Analysis | Feedback
Share Repurchases
- In June 2024, Caterpillar's Board of Directors increased its share repurchase authorization by $20 billion, bringing the total current authorization to approximately $21.8 billion. This authorization was initially launched in 2022 and has no expiration date.
- Caterpillar returned over $10 billion to shareholders through share repurchases and dividends in 2024.
- In 2025, the company deployed $7.9 billion of cash for share repurchases and dividends.
Share Issuance
- The number of outstanding shares has consistently declined over the past few years, indicating net share repurchases rather than issuances.
- Caterpillar's shares outstanding were 467.98 million at the end of 2025, a 3.49% decline from 2024.
- Shares outstanding were 477.932 million in 2024, a 4.71% decrease from 2023.
Outbound Investments
- In October 2025, Caterpillar acquired RPMGlobal Holdings Limited, a provider of mine design, planning, and scheduling software, for $728 million.
- The company acquired Tangent Energy Solutions, Inc. in May 2022, focusing on energy usage monitoring solutions for commercial and industrial sectors.
- Caterpillar also acquired CarbonPoint Solutions in September 2021, a company specializing in carbon capture technology.
Capital Expenditures
- Capital expenditures increased consistently from 2021 to 2025, peaking at $4.286 billion in 2025.
- For 2026, projected capital expenditures are expected to be around $3.5 billion, primarily for capacity expansion.
- Caterpillar is making significant investments in advanced technologies such as autonomy, alternative fuels, connectivity, digital, and electrification to meet customer demands. Notably, in October 2025, a $725 million capital expansion was announced for its Lafayette, Indiana engine facility to boost engine production, particularly for data centers.

Latest Trefis Analyses
Research & Analysis
Invest in Strategies
Wealth Management
Peer Comparisons
| Peers to compare with: |
Financials
| Median | |
|---|---|
| Name | |
| Mkt Price | 367.51 |
| Mkt Cap | 78.5 |
| Rev LTM | 30,837 |
| Op Inc LTM | 3,301 |
| FCF LTM | 2,885 |
| FCF 3Y Avg | 2,391 |
| CFO LTM | 4,205 |
| CFO 3Y Avg | 3,737 |
Growth & Margins
| Median | |
|---|---|
| Name | |
| Rev Chg LTM | 2.1% |
| Rev Chg 3Y Avg | 4.6% |
| Rev Chg Q | 3.6% |
| QoQ Delta Rev Chg LTM | 1.0% |
| Op Inc Chg LTM | -13.5% |
| Op Inc Chg 3Y Avg | -0.2% |
| Op Mgn LTM | 10.6% |
| Op Mgn 3Y Avg | 11.2% |
| QoQ Delta Op Mgn LTM | -0.5% |
| CFO/Rev LTM | 13.9% |
| CFO/Rev 3Y Avg | 11.5% |
| FCF/Rev LTM | 8.0% |
| FCF/Rev 3Y Avg | 7.0% |
Valuation
| Median | |
|---|---|
| Name | |
| Mkt Cap | 78.5 |
| P/S | 2.5 |
| P/Op Inc | 21.7 |
| P/EBIT | 21.0 |
| P/E | 33.9 |
| P/CFO | 17.4 |
| Total Yield | 4.1% |
| Dividend Yield | 1.1% |
| FCF Yield 3Y Avg | 4.1% |
| D/E | 0.2 |
| Net D/E | 0.1 |
Returns
| Median | |
|---|---|
| Name | |
| 1M Rtn | 1.2% |
| 3M Rtn | 7.7% |
| 6M Rtn | 12.1% |
| 12M Rtn | 32.9% |
| 3Y Rtn | 65.7% |
| 1M Excs Rtn | 0.6% |
| 3M Excs Rtn | -7.6% |
| 6M Excs Rtn | 5.2% |
| 12M Excs Rtn | 10.2% |
| 3Y Excs Rtn | -3.7% |
Comparison Analyses
Segment Financials
Revenue by Segment| $ Mil | 2025 | 2024 | 2023 | 2022 | 2021 |
|---|---|---|---|---|---|
| Power & Energy | 32,201 | 28,854 | 28,001 | 19,337 | 16,670 |
| Construction Industries | 25,060 | 25,455 | 27,418 | 25,127 | 21,994 |
| Resource Industries | 12,474 | 12,389 | 13,583 | 12,013 | 9,502 |
| Financial Products Segment | 4,220 | 4,053 | 3,785 | 3,253 | 3,073 |
| All Other Segment | 327 | 425 | 449 | 145 | 145 |
| Corporate Items and Eliminations | -6,693 | -6,367 | -6,176 | -448 | -413 |
| Total | 67,589 | 64,809 | 67,060 | 59,427 | 50,971 |
| $ Mil | 2004 | 2003 | 2002 | 2001 | 2000 |
|---|---|---|---|---|---|
| Construction & Mining Products | 1,150 | 538 | 431 | 526 | 639 |
| All Other | 655 | 350 | 323 | 248 | 233 |
| Financing & Insurance Services | 460 | 339 | 268 | 334 | 253 |
| North America Marketing | 434 | 177 | 64 | 54 | 79 |
| Power Products | 408 | -87 | 34 | 195 | 487 |
| EAME Marketing | 380 | 177 | 135 | 164 | 195 |
| Latin America Marketing | 180 | 62 | 72 | 59 | 43 |
| Asia/ Pacific Marketing | 133 | 115 | 113 | 18 | 39 |
| Total | 3,800 | 1,671 | 1,440 | 1,598 | 1,968 |
| $ Mil | 2025 | 2024 | 2023 | 2022 | 2021 |
|---|---|---|---|---|---|
| Financial Products Segment | 41,476 | 36,925 | 35,685 | 34,269 | 34,860 |
| Liabilities included in segment assets | 15,330 | 11,973 | 11,781 | 12,519 | 10,777 |
| Power & Energy | 11,387 | 11,772 | 10,555 | 9,455 | 9,253 |
| Cash and cash equivalents | 9,333 | 6,165 | 6,106 | 6,042 | 8,428 |
| Resource Industries | 6,087 | 5,548 | 5,742 | 5,775 | 5,962 |
| Construction Industries | 5,442 | 5,546 | 5,384 | 5,168 | 4,547 |
| Property, plant and equipment - net and other assets | 4,689 | 4,808 | 6,548 | 4,234 | 4,056 |
| Goodwill and intangible assets | 4,669 | 4,478 | 4,452 | 4,248 | 4,859 |
| Deferred income taxes | 2,749 | 3,194 | 2,668 | 2,098 | 1,735 |
| All Other Segment | 1,516 | 1,937 | 1,890 | 1,828 | 1,678 |
| Other | -471 | -1,022 | -166 | -630 | -706 |
| Inventory methodology differences | -3,622 | -3,560 | -3,169 | -3,063 | -2,656 |
| Total | 98,585 | 87,764 | 87,476 | 81,943 | 82,793 |
Price Behavior
| Market Price | $914.30 | |
| Market Cap ($ Bil) | 423.7 | |
| First Trading Date | 01/02/1962 | |
| Distance from 52W High | -14.1% | |
| 50 Days | 200 Days | |
| DMA Price | $929.44 | $714.45 |
| DMA Trend | up | up |
| Distance from DMA | -1.6% | 28.0% |
| 3M | 1YR | |
| Volatility | 47.4% | 37.9% |
| Downside Capture | 233.47 | 147.77 |
| Upside Capture | 233.97 | 210.47 |
| Correlation (SPY) | 54.4% | 56.5% |
| 1M | 2M | 3M | 6M | 1Y | 3Y | |
|---|---|---|---|---|---|---|
| Beta | 2.11 | 2.01 | 1.96 | 1.86 | 1.68 | 1.26 |
| Up Beta | 0.56 | 1.24 | 1.97 | 2.08 | 1.59 | 1.16 |
| Down Beta | 2.77 | 1.86 | 1.99 | 1.74 | 1.62 | 1.21 |
| Up Capture | 419% | 302% | 277% | 334% | 403% | 425% |
| Bmk +ve Days | 11 | 24 | 40 | 67 | 140 | 429 |
| Stock +ve Days | 15 | 24 | 40 | 73 | 146 | 413 |
| Down Capture | 118% | 188% | 152% | 120% | 118% | 104% |
| Bmk -ve Days | 10 | 17 | 23 | 58 | 112 | 321 |
| Stock -ve Days | 6 | 17 | 23 | 52 | 106 | 338 |
[1] Upside and downside betas calculated using positive and negative benchmark daily returns respectively
Based On 1-Year Data
| Annualized Return | Annualized Volatility | Sharpe Ratio | Correlation with CAT | |
|---|---|---|---|---|
| CAT | 128.5% | 37.8% | 2.25 | - |
| Sector ETF (XLI) | 20.6% | 16.7% | 0.95 | 76.0% |
| Equity (SPY) | 21.9% | 12.6% | 1.30 | 56.0% |
| Gold (GLD) | 21.0% | 27.9% | 0.67 | 25.8% |
| Commodities (DBC) | 29.1% | 18.9% | 1.22 | -9.2% |
| Real Estate (VNQ) | 12.6% | 13.9% | 0.61 | 13.6% |
| Bitcoin (BTCUSD) | -46.2% | 42.9% | -1.32 | 26.1% |
Smart multi-asset allocation framework can stack odds in your favor. Learn How
Based On 5-Year Data
| Annualized Return | Annualized Volatility | Sharpe Ratio | Correlation with CAT | |
|---|---|---|---|---|
| CAT | 36.1% | 31.3% | 1.02 | - |
| Sector ETF (XLI) | 13.4% | 17.6% | 0.60 | 74.3% |
| Equity (SPY) | 13.2% | 17.1% | 0.59 | 57.5% |
| Gold (GLD) | 17.2% | 18.4% | 0.76 | 15.1% |
| Commodities (DBC) | 9.0% | 19.5% | 0.35 | 24.9% |
| Real Estate (VNQ) | 2.7% | 18.9% | 0.04 | 38.2% |
| Bitcoin (BTCUSD) | 13.8% | 53.5% | 0.44 | 23.7% |
Smart multi-asset allocation framework can stack odds in your favor. Learn How
Based On 10-Year Data
| Annualized Return | Annualized Volatility | Sharpe Ratio | Correlation with CAT | |
|---|---|---|---|---|
| CAT | 31.5% | 31.2% | 0.94 | - |
| Sector ETF (XLI) | 14.4% | 20.0% | 0.63 | 76.4% |
| Equity (SPY) | 15.6% | 17.9% | 0.74 | 63.0% |
| Gold (GLD) | 11.1% | 16.1% | 0.56 | 6.8% |
| Commodities (DBC) | 6.7% | 18.0% | 0.29 | 31.8% |
| Real Estate (VNQ) | 5.0% | 20.7% | 0.20 | 42.5% |
| Bitcoin (BTCUSD) | 57.9% | 66.2% | 0.98 | 15.8% |
Smart multi-asset allocation framework can stack odds in your favor. Learn How
Returns Analyses
Earnings Returns History
Updated 6/3/2026| Forward Returns | |||
|---|---|---|---|
| Earnings Date | 1D Returns | 5D Returns | 21D Returns |
| 4/30/2026 | 9.9% | 14.4% | 8.1% |
| 1/29/2026 | 3.4% | 7.5% | 15.5% |
| 10/29/2025 | 11.6% | 4.4% | 9.4% |
| 8/5/2025 | 0.1% | -5.8% | -4.3% |
| 4/30/2025 | 0.6% | 4.4% | 14.4% |
| 1/30/2025 | -4.6% | -8.7% | -12.5% |
| 10/30/2024 | -2.1% | -1.1% | 4.2% |
| 8/6/2024 | 3.0% | 6.1% | 6.3% |
| ... | |||
| SUMMARY STATS | |||
| # Positive | 10 | 13 | 16 |
| # Negative | 14 | 11 | 8 |
| Median Positive | 3.7% | 4.4% | 6.1% |
| Median Negative | -3.0% | -3.9% | -4.2% |
| Max Positive | 11.6% | 14.4% | 19.7% |
| Max Negative | -7.0% | -8.9% | -12.5% |
| Forward Returns | |||
|---|---|---|---|
| Earnings Date | 1D Returns | 5D Returns | 21D Returns |
| 4/30/2026 | 9.9% | 14.4% | 8.1% |
| 1/29/2026 | 3.4% | 7.5% | 15.5% |
| 10/29/2025 | 11.6% | 4.4% | 9.4% |
| 8/5/2025 | 0.1% | -5.8% | -4.3% |
| 4/30/2025 | 0.6% | 4.4% | 14.4% |
| 1/30/2025 | -4.6% | -8.7% | -12.5% |
| 10/30/2024 | -2.1% | -1.1% | 4.2% |
| 8/6/2024 | 3.0% | 6.1% | 6.3% |
| 4/25/2024 | -7.0% | -8.9% | -3.5% |
| 2/5/2024 | 2.0% | 0.7% | 5.9% |
| 10/31/2023 | -6.7% | -1.6% | 3.0% |
| 8/1/2023 | 8.9% | 6.2% | 5.6% |
| 4/27/2023 | -0.9% | -0.3% | -2.9% |
| 1/31/2023 | -3.5% | -3.9% | -4.9% |
| 10/27/2022 | 7.7% | 8.9% | 19.7% |
| 8/2/2022 | -5.8% | -4.6% | -4.1% |
| 4/28/2022 | -0.7% | 4.0% | -0.5% |
| 1/28/2022 | -5.2% | -5.5% | -11.6% |
| 10/28/2021 | 4.1% | 3.8% | 1.3% |
| 7/30/2021 | -2.7% | -2.5% | 0.1% |
| 4/29/2021 | -2.1% | 2.4% | 3.9% |
| 1/29/2021 | -0.8% | 4.0% | 19.2% |
| 10/27/2020 | -3.2% | 0.0% | 8.4% |
| 7/31/2020 | -2.8% | -1.7% | 5.0% |
| SUMMARY STATS | |||
| # Positive | 10 | 13 | 16 |
| # Negative | 14 | 11 | 8 |
| Median Positive | 3.7% | 4.4% | 6.1% |
| Median Negative | -3.0% | -3.9% | -4.2% |
| Max Positive | 11.6% | 14.4% | 19.7% |
| Max Negative | -7.0% | -8.9% | -12.5% |
SEC Filings
Expand for More| Report Date | Filing Date | Filing |
|---|---|---|
| 03/31/2026 | 05/06/2026 | 10-Q |
| 12/31/2025 | 02/13/2026 | 10-K |
| 09/30/2025 | 11/03/2025 | 10-Q |
| 06/30/2025 | 08/06/2025 | 10-Q |
| 03/31/2025 | 05/07/2025 | 10-Q |
| 12/31/2024 | 02/14/2025 | 10-K |
| 09/30/2024 | 11/06/2024 | 10-Q |
| 06/30/2024 | 08/07/2024 | 10-Q |
| 03/31/2024 | 05/01/2024 | 10-Q |
| 12/31/2023 | 02/16/2024 | 10-K |
| 09/30/2023 | 11/01/2023 | 10-Q |
| 06/30/2023 | 08/02/2023 | 10-Q |
| 03/31/2023 | 05/03/2023 | 10-Q |
| 12/31/2022 | 02/15/2023 | 10-K |
| 09/30/2022 | 11/02/2022 | 10-Q |
| 06/30/2022 | 08/03/2022 | 10-Q |
| Report Date | Filing Date | Filing |
|---|---|---|
| 03/31/2026 | 05/06/2026 | 10-Q |
| 12/31/2025 | 02/13/2026 | 10-K |
| 09/30/2025 | 11/03/2025 | 10-Q |
| 06/30/2025 | 08/06/2025 | 10-Q |
| 03/31/2025 | 05/07/2025 | 10-Q |
| 12/31/2024 | 02/14/2025 | 10-K |
| 09/30/2024 | 11/06/2024 | 10-Q |
| 06/30/2024 | 08/07/2024 | 10-Q |
| 03/31/2024 | 05/01/2024 | 10-Q |
| 12/31/2023 | 02/16/2024 | 10-K |
| 09/30/2023 | 11/01/2023 | 10-Q |
| 06/30/2023 | 08/02/2023 | 10-Q |
| 03/31/2023 | 05/03/2023 | 10-Q |
| 12/31/2022 | 02/15/2023 | 10-K |
| 09/30/2022 | 11/02/2022 | 10-Q |
| 06/30/2022 | 08/03/2022 | 10-Q |
| 03/31/2022 | 05/04/2022 | 10-Q |
| 12/31/2021 | 02/16/2022 | 10-K |
| 09/30/2021 | 11/03/2021 | 10-Q |
| 06/30/2021 | 08/04/2021 | 10-Q |
| 03/31/2021 | 05/05/2021 | 10-Q |
| 12/31/2020 | 02/17/2021 | 10-K |
| 09/30/2020 | 11/04/2020 | 10-Q |
| 06/30/2020 | 08/05/2020 | 10-Q |
| 03/31/2020 | 05/06/2020 | 10-Q |
| 12/31/2019 | 02/19/2020 | 10-K |
| 09/30/2019 | 10/31/2019 | 10-Q |
| 06/30/2019 | 08/01/2019 | 10-Q |
Insider Activity
Updated 7/1/2026| # | Owner | Title | Holding | Action | Filing Date | Price | Shares | Transacted Value | Value of Held Shares | Form |
|---|---|---|---|---|---|---|---|---|---|---|
| 1 | Johnson, Denise C | Group President | Direct | Sell | 5152026 | 907.91 | 12,605 | 11,444,170 | 45,236,474 | Form |
| 2 | Johnson, Denise C | Group President | Direct | Sell | 5142026 | 909.79 | 6,196 | 5,637,081 | 45,330,466 | Form |
| 3 | Schaupp, William E | Chief Accounting Officer | Direct | Sell | 5142026 | 906.00 | 360 | 326,160 | 480,180 | Form |
| 4 | Fassino, Anthony D | Group President | Direct | Sell | 5122026 | 916.80 | 16,283 | 14,928,266 | 42,210,423 | Form |
| 5 | De, Lange Bob | Group President | Direct | Sell | 5072026 | 922.92 | 24,222 | 22,354,978 | 79,397,919 | Form |
| # | Owner | Title | Holding | Action | Filing Date | Price | Shares | Transacted Value | Value of Held Shares | Form |
|---|---|---|---|---|---|---|---|---|---|---|
| 1 | Johnson, Denise C | Group President | Direct | Sell | 5152026 | 907.91 | 12,605 | 11,444,170 | 45,236,474 | Form |
| 2 | Johnson, Denise C | Group President | Direct | Sell | 5142026 | 909.79 | 6,196 | 5,637,081 | 45,330,466 | Form |
| 3 | Schaupp, William E | Chief Accounting Officer | Direct | Sell | 5142026 | 906.00 | 360 | 326,160 | 480,180 | Form |
| 4 | Fassino, Anthony D | Group President | Direct | Sell | 5122026 | 916.80 | 16,283 | 14,928,266 | 42,210,423 | Form |
| 5 | De, Lange Bob | Group President | Direct | Sell | 5072026 | 922.92 | 24,222 | 22,354,978 | 79,397,919 | Form |
| 6 | Fassino, Anthony D | Group President | Direct | Sell | 5072026 | 926.25 | 9,152 | 8,477,067 | 42,645,612 | Form |
| 7 | Bonfield, Andrew R J | CFO Emeritus | Direct | Sell | 5072026 | 918.71 | 15,674 | 14,399,861 | 48,631,914 | Form |
| 8 | Kaiser, Jason | Group President | Direct | Sell | 5052026 | 883.03 | 5,642 | 4,982,055 | 8,471,790 | Form |
| 9 | MacLennan, David | Direct | Buy | 5052026 | 876.84 | 250 | 219,210 | 7,195,349 | Form | |
| 10 | Creed, Joseph E | Chief Executive Officer | Direct | Sell | 3062026 | 718.93 | 2,500 | 1,797,317 | 25,222,107 | Form |
| 11 | Shurman, Rodney Michael | Group President | Direct | Sell | 2242026 | 759.61 | 2,278 | 1,730,392 | 1,096,117 | Form |
| 12 | Shurman, Rodney Michael | Group President | Direct | Sell | 2182026 | 763.39 | 1,764 | 1,346,620 | 1,099,282 | Form |
| 13 | Schaupp, William E | Chief Accounting Officer | Direct | Sell | 2182026 | 764.20 | 972 | 742,802 | 629,701 | Form |
| 14 | Fassino, Anthony D | Group President | Direct | Sell | 2172026 | 776.90 | 7,891 | 6,130,518 | 36,236,947 | Form |
| 15 | Kaiser, Jason | Group President | Direct | Sell | 2132026 | 776.70 | 1,690 | 1,312,623 | 6,726,999 | Form |
| 16 | De, Lange Bob | Group President | Direct | Sell | 2132026 | 767.08 | 12,507 | 9,593,870 | 65,199,499 | Form |
| 17 | De, Lange Bob | Group President | Direct | Sell | 2092026 | 720.11 | 22,656 | 16,314,812 | 57,574,955 | Form |
| 18 | Fassino, Anthony D | Group President | Direct | Sell | 2092026 | 722.15 | 6,033 | 4,356,731 | 29,717,195 | Form |
| 19 | De, Lange Bob | Group President | Direct | Sell | 2052026 | 704.97 | 16,070 | 11,328,811 | 56,364,183 | Form |
| 20 | Fassino, Anthony D | Group President | Direct | Sell | 2032026 | 680.45 | 10,671 | 7,261,082 | 28,001,198 | Form |
| 21 | De, Lange Bob | Group President | Direct | Sell | 2032026 | 682.99 | 15,977 | 10,912,131 | 54,607,099 | Form |
| 22 | Bonfield, Andrew R J | Chief Financial Officer | Direct | Sell | 1052026 | 575.06 | 10,000 | 5,750,589 | 26,142,178 | Form |
| 23 | Bonfield, Andrew R J | Chief Financial Officer | Direct | Sell | 12022025 | 571.44 | 10,000 | 5,714,448 | 31,692,328 | Form |
| 24 | Kaiser, Jason | Group President | Direct | Sell | 11132025 | 563.60 | 10,707 | 6,034,490 | 4,874,597 | Form |
| 25 | Fassino, Anthony D | Group President | Direct | Sell | 11122025 | 570.18 | 8,184 | 4,666,353 | 23,669,312 | Form |
| 26 | De, Lange Bob | Group President | Direct | Sell | 11072025 | 562.36 | 14,638 | 8,231,826 | 45,106,333 | Form |
| 27 | MacLennan, David | Direct | Buy | 11062025 | 568.86 | 300 | 170,658 | 4,520,730 | Form | |
| 28 | Schaupp, William E | Chief Accounting Officer | Direct | Sell | 11062025 | 572.22 | 1,200 | 686,664 | 757,047 | Form |
| 29 | Umpleby, Iii Donald J | Executive Chairman | Direct | Sell | 10142025 | 505.29 | 17,166 | 8,673,808 | 226,457,335 | Form |
| 30 | Umpleby, Iii Donald J | Executive Chairman | Direct | Sell | 9232025 | 462.65 | 17,166 | 7,941,850 | 215,289,088 | Form |
| 31 | Umpleby, Iii Donald J | Executive Chairman | Direct | Sell | 9032025 | 412.87 | 17,168 | 7,088,152 | 199,211,839 | Form |
| 32 | Schwab, Susan C | Direct | Sell | 8192025 | 410.00 | 2,324 | 952,840 | 2,835,970 | Form | |
| 33 | Kaiser, Jason | Group President | Direct | Sell | 8132025 | 417.70 | 2,161 | 902,650 | 3,605,586 | Form |
Investor Activity (13F)
Updated Jul 16, 2026Active managers (13F portfolio over $250M, at least 3 holdings) with a position over $5M that is either over 10% of their portfolio or held in a concentrated book of 50 or fewer total positions. Index/ETF, sovereign, bank, community-bank and charitable/donor-advised filers are excluded.
| Active Manager | Value | % of Portfolio | Total Positions | QoQ | Filing |
|---|---|---|---|---|---|
| Gates Foundation Trust | $4.5 Bil | 14.2% | 22 | Hold | 13F |
| Westchester Capital Management, Inc. | $41.7 Mil | 8.4% | 45 | Hold | 13F |
| Regents Gate Capital LLP | $17.7 Mil | 3.8% | 36 | New | 13F |
| Minneapolis Portfolio Management Group, LLC | $35.2 Mil | 3.7% | 33 | TRIM -28.1% | 13F |
| Oribel Capital Management, LP | $21.3 Mil | 3.2% | 41 | New | 13F |
| DKRT Investments Corp. | $10.6 Mil | 2.7% | 48 | Hold | 13F |
| Cumberland Advisors Inc | $6.7 Mil | 2.6% | 48 | Hold | 13F |
| Blackhill Capital Inc | $42.2 Mil | 2.2% | 49 | Hold | 13F |
| Albar Capital Partners LLP | $10.7 Mil | 1.7% | 36 | TRIM -71.1% | 13F |
| Active Manager | Value | % of Portfolio | Total Positions | QoQ | As Of | Filing |
|---|---|---|---|---|---|---|
| Electron Capital Partners, LLC | $42.8 Mil | 2.0% | 40 | Exited | Dec 31, 2025 | 13F |
| Generali Powszechne Towarzystwo Emerytalne | $14.4 Mil | 2.5% | 30 | Exited | Dec 31, 2025 | 13F |
| Albar Capital Partners LLP | $10.7 Mil | 1.7% | 36 | TRIM -71.1% | Mar 31, 2026 | 13F |
| Minneapolis Portfolio Management Group, LLC | $35.2 Mil | 3.7% | 33 | TRIM -28.1% | Mar 31, 2026 | 13F |
| Active Manager | Value | % of Portfolio | Total Positions | QoQ | Filing |
|---|---|---|---|---|---|
| Gates Foundation Trust | $4.5 Bil | 14.2% | 22 | Hold | 13F |
| Blackhill Capital Inc | $42.2 Mil | 2.2% | 49 | Hold | 13F |
| Westchester Capital Management, Inc. | $41.7 Mil | 8.4% | 45 | Hold | 13F |
| Minneapolis Portfolio Management Group, LLC | $35.2 Mil | 3.7% | 33 | TRIM -28.1% | 13F |
| Oribel Capital Management, LP | $21.3 Mil | 3.2% | 41 | New | 13F |
| Regents Gate Capital LLP | $17.7 Mil | 3.8% | 36 | New | 13F |
| Albar Capital Partners LLP | $10.7 Mil | 1.7% | 36 | TRIM -71.1% | 13F |
| DKRT Investments Corp. | $10.6 Mil | 2.7% | 48 | Hold | 13F |
| Cumberland Advisors Inc | $6.7 Mil | 2.6% | 48 | Hold | 13F |
CAT Trade Sentinel
High Conviction
CONVICTION RATIONALE
Caterpillar is capturing a structural, multi-year demand wave for power generation driven by the data center build-out. This is confirmed by a record $62.7 billion backlog and a plan to nearly triple engine capacity. Management has raised its full-year 2026 revenue growth outlook to low-double-digits, demonstrating high confidence in the durability of this new growth profile.
STOCK ARCHETYPE
Capital Goods & Industrial Manufacturing(Number of Units Sold × Average Selling Price) + Services & Parts Revenue + Financing Revenue The mix shift towards the higher-margin Power & Energy segment, coupled with price realization, versus the headwind of manufacturing costs and tariffs.
INVESTMENT THESIS
Evidence points to a multi-year growth inflection, transforming the company's earnings power beyond its traditional cyclical profile.
- Order backlog grew 79% year-over-year to a record $62.7 billion in Q1 2026.
- Full-year 2026 revenue growth guidance was raised to 'low double digits'.
- Company is increasing large reciprocating engine capacity to nearly 3x 2024 levels.
- Recent agreements include orders for up to 2.1 gigawatts of power generation.
- Of the total backlog, $24.8 billion is not expected to be filled in the next year.
PRIMARY RISK
Persistent cost pressures could offset top-line strength. Trailing operating margin fell 2.7 percentage points to 16.5%, and the company forecasts a $2.2 billion to $2.4 billion tariff impact for 2026.
- Trailing-twelve-month operating margin is 16.5%, down from 19.2% a year earlier.
- Management forecasts tariff costs to be around $2.2 billion to $2.4 billion in 2026.
- Unfavorable manufacturing costs in 2025 largely reflected higher tariff costs.
- Shareholder payouts of $9.4 billion exceeded free cash flow of $7.9 billion.
| KPI | Status | Rationale |
|---|---|---|
| Order Backlog | A record $62.7 billion at the end of Q1 2026. - Accelerating | The backlog is experiencing massive growth, reaching a record level. The year-over-year growth rate is accelerating, driven by what management describes as an 'all-time record' for quarterly orders, particularly from the Power & Energy segment to support data center build-outs. |
| Sales to Users (Retail Sales) | Growth across all three primary segments in Q1 2026: Power & Energy +32%, Construction Industries +7%, and Resource Industries +6%. - Stable | End-user demand remains robust and broad-based. Power & Energy growth is exceptionally strong, driven by data centers. Construction Industries growth is healthy, and Resource Industries has rebounded from a weak prior quarter. |
| Sales to Users Growth | Grew in all three primary segments (Q1 2026) | Measures retail sales from dealers to end customers, providing a direct indicator of end-market demand and business momentum, distinct from wholesale shipments to dealers. |
Data Center Super-Cycle vs. Tariff-Driven Margin Squeeze
BULL VIEW
Bulls focus on the record $62.7 billion backlog and raised 2026 guidance, seeing a structural demand shift that will power earnings for years, overwhelming any cost pressures.
CORE TENSION
Can record backlog growth of 79% YoY drive profits higher despite a forecasted $2.2B-$2.4B tariff headwind that is compressing current margins?
PREVAILING SENTIMENT
The latest evidence favors the bulls. Management raised 2026 revenue guidance after Q1 and beat its own tariff cost estimate, suggesting the headwind is manageable.
BEAR VIEW
Bears see operating margins down 2.7 percentage points and a $2.2 billion to $2.4 billion tariff headwind, arguing that cost pressures will cap any benefit from higher sales.
| Timeline | Event & Metric To Watch |
|---|---|
8/20/2026 | Peer Demand Signal Weakens Watch: Deere's commentary on construction equipment demand and order rates, particularly in North America. |
August 2026 | Credit Facility Expiration Watch: A 364-day credit facility of $3.500 billion is scheduled to expire. |
10/19/2026 | PACCAR Earnings Report Watch: Peer PACCAR (PCAR) is scheduled to report earnings. |
10/27/2026 | Tariff Impact Exceeds Guidance Watch: Reported Q2/Q3 tariff costs versus guidance, and management's updated full-year forecast for both tariffs and operating margin. |
10/27/2026 | Construction Market Deceleration Watch: Construction Industries sales growth, sales to users trends, and any change in the full-year outlook for the segment. |
10/27/2026 | Company Earnings Report Watch: Caterpillar is scheduled to report its next quarterly earnings. |
10/28/2026 | Terex Earnings Report Watch: Peer Terex (TEX) is scheduled to report earnings. |
| Date | Event | Stock Impact |
|---|---|---|
2026-07-07 | Skycatch Technology Acquisition Details: Caterpillar acquired Skycatch, Inc., a provider of spatial data capture and analysis solutions for the mining industry, to enhance its data-driven technology portfolio. | -2.3% $969.92 -> $948.08 |
2026-06-10 | Quarterly Dividend Increased Details: The Board of Directors voted to raise the quarterly dividend by eight percent to one dollar and sixty-three cents ($1.63) per share. | -1.9% $914.70 -> $897.63 |
2026-04-30 | Q1 2026 Results Reported Details: First-quarter sales and revenues increased 22% to $17.4 billion, with adjusted profit per share of $5.54. The company deployed $5.7 billion for share repurchases and dividends. | +9.8% $810.05 -> $889.67 |
2026-04-29 | PROWR Power Generation Agreement Details: The PROPWR business unit entered a strategic framework agreement with Caterpillar to purchase up to 2.1 gigawatts of incremental power generation capacity by 2031. | +8.8% $817.87 -> $890.11 |
2026-01-29 | Q4 and Full-Year 2025 Results Details: The company reported record full-year 2025 sales and revenues of $67.6 billion and adjusted profit per share of $19.06. Full-year operating cash flow was $11.7 billion. | +2.2% $642.06 -> $656.11 |
2026-01-28 | AIP Corp Strategic Alliance Details: Caterpillar announced a strategic alliance with American Intelligence & Power Corporation to deploy 2 gigawatts of dedicated power for a large-scale AI infrastructure campus. | +4.1% $637.70 -> $663.98 |
Position Sizing
2% - 4%
REDUCED POSITION
Sizing is volatility-based: CAT trades at roughly 47% annualized options-implied volatility versus about 13% for the S&P 500 (3.6x the market), around the 99th percentile of its own trailing year. A 2% - 4% position keeps a single-name swing of that size within a diversified portfolio's risk budget.
Diversification Alternatives
DE - Deere & Company
Pure-Play Machinery CyclicalDeere offers more focused exposure to agricultural and construction cycles. Its trailing-twelve-month operating margin of 17.4% is currently higher than Caterpillar's 16.5%.
CMI - Cummins Inc.
Focused Powertrain SpecialistCummins is a more direct competitor in engines and power generation. It provides a focused play on global power systems with a smaller capital expenditure budget of $1.3 billion.
Caterpillar is a primary arms dealer for the global build-out of physical infrastructure, from roads and mines to the critical power systems underpinning the digital economy.
Beyond its well-known cyclical exposure to construction and mining, Caterpillar's Power & Energy segment has become its primary growth and profit engine. This is driven by a structural demand surge from data centers requiring massive, reliable power solutions for cloud computing and AI. This has resulted in a record-breaking backlog and a multi-year capacity expansion, transforming the company's growth profile from purely cyclical to having a strong secular tailwind.
Continued announcements of large, multi-gigawatt orders for power generation, especially for data centers, and sustained backlog growth.
A significant global recession that curtails infrastructure and mining capital expenditures, or a technological shift in data center power architecture away from reciprocating engines and turbines.
Short-term fluctuations in individual commodity prices or regional construction data, which may not reflect the broader strength in the power generation and infrastructure backlog.
Repricing Catalyst
The market's increasing recognition of the scale and duration of the data center power demand cycle, which is driving a multi-year, high-margin growth trajectory backed by a record backlog and significant capacity expansion.
Construction Industries
$27.0B TTM (38% of Total)What It Is
Sells a portfolio of machinery including asphalt pavers, excavators, wheel loaders, and track-type tractors to customers in infrastructure and building construction applications, as well as rental, quarry, and mining industries.
Who Pays & How
Construction and infrastructure companies pay for machinery that helps them build projects. Customers in developed economies often prioritize productivity and low lifetime owning/operating costs, while those in developing economies may prioritize purchase price.
Competition
Resource Industries
$12.6B TTM (18% of Total)What It Is
Sells large machinery such as mining trucks, electric rope shovels, and large wheel loaders to customers in mining, heavy construction, and quarry and aggregates.
Who Pays & How
Mining and heavy construction companies pay for high-productivity, reliable equipment that provides the lowest total cost of ownership. The segment also sells technology products for fleet management and autonomous machine capabilities.
Competition
Power & Energy
$33.4B TTM (47% of Total)What It Is
Sells reciprocating engines, generator sets, turbines, and locomotives to customers in oil and gas, power generation, marine, rail, and industrial applications.
Who Pays & How
Companies in energy, transportation, and data center industries pay for reliable power solutions. Data center customers, in particular, are driving demand for both backup and prime power to support build-outs related to cloud computing and AI.
Competition
Financial Products Segment
$4.3B TTM (6% of Total)What It Is
Provides retail and wholesale financing and insurance products to customers and dealers for Caterpillar equipment.
Who Pays & How
Customers and dealers use financing to purchase and lease Caterpillar equipment. The segment generates financing income and supports the sale of Caterpillar products.
Competition
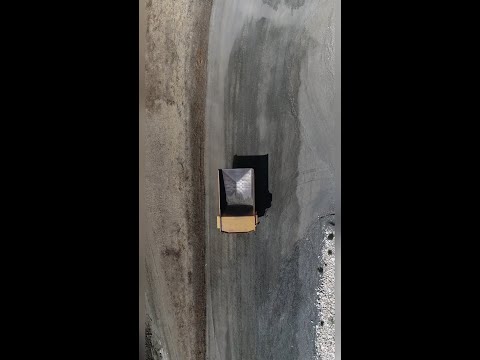
Caterpillar — Investor Video Playlist


Industry Resources
| Industrials Resources |
| IndustryWeek |
| Manufacturing.net |
| Aviation Week |
| Construction Machinery & Heavy Transportation Equipment Resources |
| Equipment World |
| Construction Equipment |
| OEM Off-Highway |
External Quote Links
| Y Finance | Barrons |
| TradingView | Morningstar |
| SeekingAlpha | ValueLine |
| Motley Fool | Robinhood |
| CNBC | Etrade |
| MarketWatch | Unusual Whales |
| YCharts | Perplexity Finance |
| FinViz |
Prefer one of these to Trefis? Tell us why.