
Gold X2 Mining (AUXX)
Market Price (11/6/2026): $3.92 | Market Cap: $396.6 MilSector: Materials | Industry: Gold
Gold X2 Mining (AUXX)
Market Price (11/6/2026): $3.92Market Cap: $396.6 MilSector: MaterialsIndustry: Gold
Investment Highlights Why It Matters Detailed financial logic regarding cash flow yields vs trend-riding momentum.
Cash is significant % of market capNet D/ENet Debt/Equity. Debt net of cash. Negative indicates net cash. Equity is taken as the Market Capitalization is -30% Megatrend and thematic driversMegatrends include Raw Materials & Precious Metals. Themes include Precious Metals Extraction, and Sustainable Mining Practices. | Weak multi-year price returns2Y Excs Rtn is -83%, 3Y Excs Rtn is -131% | Very low revenueRev LTMTotal Revenue or Sales, Last Twelve Months is 0 Not profitable at operating income levelOp Inc LTMOperating Income, Last Twelve Months is -65 Mil Yield minus risk free rate is negativeERPEquity Risk Premium (ERP) = Total Yield - Risk Free Rate, Reflects the premium above risk free assets offered by the investment. is -20% Significant short interestShort Interest Days-to-CoverDTC = (Short Interest Share Quantity) / (Average Daily Trading Volume). Reflects how many days it would take to cover (close out) the short interest based on average volumes. High DTC can signify an increased risk of a short squeeze. is 24.22 Key risksAUXX key risks include [1] its dependence on successful exploration and development outcomes from its non-producing properties and [2] its need to secure adequate financing to fund operations as a company without revenue. |
| Cash is significant % of market capNet D/ENet Debt/Equity. Debt net of cash. Negative indicates net cash. Equity is taken as the Market Capitalization is -30% |
| Megatrend and thematic driversMegatrends include Raw Materials & Precious Metals. Themes include Precious Metals Extraction, and Sustainable Mining Practices. |
| Weak multi-year price returns2Y Excs Rtn is -83%, 3Y Excs Rtn is -131% |
| Very low revenueRev LTMTotal Revenue or Sales, Last Twelve Months is 0 |
| Not profitable at operating income levelOp Inc LTMOperating Income, Last Twelve Months is -65 Mil |
| Yield minus risk free rate is negativeERPEquity Risk Premium (ERP) = Total Yield - Risk Free Rate, Reflects the premium above risk free assets offered by the investment. is -20% |
| Significant short interestShort Interest Days-to-CoverDTC = (Short Interest Share Quantity) / (Average Daily Trading Volume). Reflects how many days it would take to cover (close out) the short interest based on average volumes. High DTC can signify an increased risk of a short squeeze. is 24.22 |
| Key risksAUXX key risks include [1] its dependence on successful exploration and development outcomes from its non-producing properties and [2] its need to secure adequate financing to fund operations as a company without revenue. |
Qualitative Assessment
AI Analysis | Feedback
Gold X2 Mining (AUXX) stock has lost about 50% since it went public on 9/8/2026 because of the following key factors:
1. Macroeconomic Headwinds and Declining Gold Prices.
The stock's decline was significantly influenced by a less favorable macroeconomic environment for gold. The Federal Reserve raised its interest rate range to 3.75–4.00% on September 16, 2026, marking the first increase since 2023 and signaling further potential hikes. This action typically strengthens the U.S. dollar and increases the opportunity cost of holding non-yielding assets like gold, putting downward pressure on its price. Consequently, gold futures dropped from $4,396.40 on September 1 to $4,168.40 by September 28, 2026. Analysts, including Goldman Sachs, revised their year-end 2026 gold price forecasts downward from $4,900 to $4,650 following the rate hike.
2. Gold X2 Mining's Development-Stage Profile and Associated Risks.
As a development-stage company, Gold X2 Mining's valuation is highly susceptible to shifts in commodity prices and investor sentiment, lacking the revenue stability of a producing gold miner. The company is focused on its Moss Gold Project, a lower-grade, bulk-tonnage deposit that necessitates substantial initial capital investment for mine construction, indicating future financing needs and potential shareholder dilution. This is underscored by its reported net loss of approximately C$14.83 million in fiscal Q2 2026, highlighting ongoing development expenses. Investors are increasingly scrutinizing the challenges and risks associated with transforming mineral resources into commercially viable operations.
Show more
Gold X2 Mining (AUXX) stock has lost about 50% since it went public on 9/8/2026 because of the following key factors:
1. Macroeconomic Headwinds and Declining Gold Prices.
The stock's decline was significantly influenced by a less favorable macroeconomic environment for gold. The Federal Reserve raised its interest rate range to 3.75–4.00% on September 16, 2026, marking the first increase since 2023 and signaling further potential hikes. This action typically strengthens the U.S. dollar and increases the opportunity cost of holding non-yielding assets like gold, putting downward pressure on its price. Consequently, gold futures dropped from $4,396.40 on September 1 to $4,168.40 by September 28, 2026. Analysts, including Goldman Sachs, revised their year-end 2026 gold price forecasts downward from $4,900 to $4,650 following the rate hike.
2. Gold X2 Mining's Development-Stage Profile and Associated Risks.
As a development-stage company, Gold X2 Mining's valuation is highly susceptible to shifts in commodity prices and investor sentiment, lacking the revenue stability of a producing gold miner. The company is focused on its Moss Gold Project, a lower-grade, bulk-tonnage deposit that necessitates substantial initial capital investment for mine construction, indicating future financing needs and potential shareholder dilution. This is underscored by its reported net loss of approximately C$14.83 million in fiscal Q2 2026, highlighting ongoing development expenses. Investors are increasingly scrutinizing the challenges and risks associated with transforming mineral resources into commercially viable operations.
3. Post-IPO Profit-Taking and Market Reassessment.
Following its listing on the NYSE American on September 8, 2026, Gold X2 Mining (AUXX) experienced a period of profit-taking and a re-evaluation of its market valuation. For instance, the stock saw a 3.10% decline on October 2, 2026, and a 7.81% drop on September 15, 2026, as traders realized gains and adjusted positions. Such volatility and profit-taking are common for newly public companies, particularly those in the capital-intensive and speculative mineral exploration sector, as the market seeks a stable valuation equilibrium after the initial listing excitement.
Show less
Stock Movement Drivers
Fundamental Drivers
nullnull
Market Drivers
7/31/2026 to 11/5/2026| Return | Correlation | |
|---|---|---|
| AUXX | ||
| Market (SPY) | -1.9% | 27.4% |
| Sector (XLB) | 3.8% | 33.2% |
Fundamental Drivers
nullnull
Market Drivers
4/30/2026 to 11/5/2026| Return | Correlation | |
|---|---|---|
| AUXX | ||
| Market (SPY) | 2.3% | 27.4% |
| Sector (XLB) | 2.1% | 33.2% |
Fundamental Drivers
nullnull
Market Drivers
10/31/2025 to 11/5/2026| Return | Correlation | |
|---|---|---|
| AUXX | ||
| Market (SPY) | 8.4% | 27.4% |
| Sector (XLB) | 23.8% | 33.2% |
Fundamental Drivers
nullnull
Market Drivers
10/31/2023 to 11/5/2026| Return | Correlation | |
|---|---|---|
| AUXX | ||
| Market (SPY) | 81.3% | 27.4% |
| Sector (XLB) | 45.1% | 33.2% |
Price Returns Compared
| 2021 | 2022 | 2023 | 2024 | 2025 | 2026 | Total [1] | |
|---|---|---|---|---|---|---|---|
| Returns | |||||||
| AUXX Return | - | - | - | - | - | -48% | -48% |
| Peers Return | 3% | -16% | 29% | 40% | 125% | -13% | 208% |
| S&P 500 Return | 27% | -19% | 24% | 23% | 16% | 12% | 105% |
Monthly Win Rates [3] | |||||||
| AUXX Win Rate | - | - | - | - | - | 33% | |
| Peers Win Rate | 53% | 48% | 45% | 55% | 70% | 40% | |
| S&P 500 Win Rate | 75% | 42% | 67% | 75% | 67% | 45% | |
Max Drawdowns [4] | |||||||
| AUXX Max Drawdown | - | - | - | - | - | - | |
| Peers Max Drawdown | -32% | -52% | -31% | -21% | -26% | -47% | |
| S&P 500 Max Drawdown | -5% | -25% | -10% | -8% | -19% | -9% | |
[1] Cumulative total returns since the beginning of 2021
[2] Peers: AGI, EQX, IAG, OR, CG.
[3] Win Rate = % of calendar months in which monthly returns were positive
[4] Max drawdown represents maximum peak-to-trough decline within a year
[5] 2026 data is for the year up to 11/5/2026 (YTD)
How Low Can It Go
AUXX has limited trading history. Below is the Materials sector ETF (XLB) in its place.
| Event | XLB | S&P 500 |
|---|---|---|
| 2025 US Tariff Shock | ||
| % Loss | -17.0% | -18.8% |
| % Gain to Breakeven | 20.5% | 23.1% |
| Time to Breakeven | 84 days | 79 days |
| Summer-Fall 2023 Five Percent Yield Shock | ||
| % Loss | -12.5% | -9.5% |
| % Gain to Breakeven | 14.3% | 10.5% |
| Time to Breakeven | 52 days | 24 days |
| 2022 Inflation Shock & Fed Tightening | ||
| % Loss | -23.5% | -24.5% |
| % Gain to Breakeven | 30.7% | 32.4% |
| Time to Breakeven | 456 days | 427 days |
| 2020 COVID-19 Crash | ||
| % Loss | -36.2% | -33.7% |
| % Gain to Breakeven | 56.8% | 50.9% |
| Time to Breakeven | 114 days | 140 days |
| Q4 2018 Fed Policy Error / Growth Scare | ||
| % Loss | -18.3% | -19.2% |
| % Gain to Breakeven | 22.4% | 23.8% |
| Time to Breakeven | 101 days | 105 days |
| 2015-2016 China Devaluation / Global Growth Scare | ||
| % Loss | -17.9% | -12.2% |
| % Gain to Breakeven | 21.7% | 13.9% |
| Time to Breakeven | 52 days | 62 days |
In The Past
State Street Materials Select Sector SPDR ETF's stock fell -17.0% during the 2025 US Tariff Shock. Such a loss loss requires a 20.5% gain to breakeven.
Preserve Wealth
Limiting losses and compounding gains is essential to preserving wealth.
Asset Allocation
Actively managed asset allocation strategies protect wealth. Learn more.
AUXX has limited trading history. Below is the Materials sector ETF (XLB) in its place.
| Event | XLB | S&P 500 |
|---|---|---|
| 2022 Inflation Shock & Fed Tightening | ||
| % Loss | -23.5% | -24.5% |
| % Gain to Breakeven | 30.7% | 32.4% |
| Time to Breakeven | 456 days | 427 days |
| 2020 COVID-19 Crash | ||
| % Loss | -36.2% | -33.7% |
| % Gain to Breakeven | 56.8% | 50.9% |
| Time to Breakeven | 114 days | 140 days |
| 2014-2016 Oil Price Collapse | ||
| % Loss | -23.8% | -6.8% |
| % Gain to Breakeven | 31.2% | 7.3% |
| Time to Breakeven | 171 days | 15 days |
| 2011 US Debt Ceiling Crisis & European Contagion | ||
| % Loss | -28.2% | -17.9% |
| % Gain to Breakeven | 39.3% | 21.8% |
| Time to Breakeven | 459 days | 123 days |
| 2008-2009 Global Financial Crisis | ||
| % Loss | -56.6% | -53.4% |
| % Gain to Breakeven | 130.3% | 114.4% |
| Time to Breakeven | 701 days | 1085 days |
In The Past
State Street Materials Select Sector SPDR ETF's stock fell -17.0% during the 2025 US Tariff Shock. Such a loss loss requires a 20.5% gain to breakeven.
Preserve Wealth
Limiting losses and compounding gains is essential to preserving wealth.
Asset Allocation
Actively managed asset allocation strategies protect wealth. Learn more.
About Gold X2 Mining (AUXX)
AI Analysis | Feedback
AI Analysis | Feedback
- Gold: A precious metal extracted from the earth and refined for sale, primarily used in jewelry, investment, and industrial applications.
AI Analysis | Feedback
AI Analysis | Feedback
AI Analysis | Feedback
Michael Henrichsen P.Geo. Chief Executive Officer, President and Director
Michael Henrichsen is the Chief Executive Officer, President, and a Director of Gold X2 Mining Inc.. A structural geologist, he previously served as the global structural geologist at Newmont, where his contributions significantly enhanced the reserves and resources base in Ghana's Ahafo district. He has also worked extensively in major gold camps across South America, the Carlin Trend, Guinea, and Canada. Gold X2 is noted to be led by the ex-global head of structural geology for the world's largest gold company and backed by one of Canada's prominent private equity firms.
Michael Kanevsky Chief Financial Officer and Corporate Secretary
Michael Kanevsky serves as the Chief Financial Officer and Corporate Secretary for Gold X2 Mining Inc.. With over 15 years of experience in the mining industry, he brings expertise in regulatory compliance and financial reporting. Prior to joining Gold X2, he was the CFO of New Found Gold Corp., where he managed the company's financial operations through its dual listing on the TSX Venture Exchange and the NYSE American. In this role, he was responsible for IFRS financial reporting, shelf prospectus and at-the-market equity offerings, treasury management, and internal controls, ensuring compliance with Canadian and U.S. securities regulations. A Chartered Professional Accountant, Mr. Kanevsky has held various senior leadership and director positions for several private companies within the mining industry.
Peter Alan Flindell Chief Operating Officer
Peter Alan Flindell is the Chief Operating Officer of Gold X2 Mining Inc.. He possesses over 40 years of experience in mineral exploration and feasibility studies. Mr. Flindell has led teams in the discovery, development, and expansion of multiple gold and copper mines across Southeast Asia, Central Asia, West Africa, Central Africa, Europe, and Central America. His career includes 12 years with Newmont Mining, 11 years with Avocet Mining, and 8 years with Signal Delta.
Sam Gibson Vice President of Corporate Development
Sam Gibson is the Vice President of Corporate Development at Gold X2 Mining Inc.. He has over 10 years of expertise in resource-focused finance, specializing in institutional sales, investment banking, and asset management. Previously, he was a Director and Head of Mining Sales at National Bank Financial, where he was responsible for driving global mining coverage and international growth.
Amiel Blajchman Vice President, Sustainability
Amiel Blajchman is the Vice President, Sustainability for Gold X2 Mining Inc.. He has more than 20 years of experience in advancing mining and resource development projects both in Canada and internationally. His prior senior roles include positions with Premier Gold Mines, Greenstone Gold Mines, Ambershaw Metallics, and Magino Mines. Mr. Blajchman has led environmental assessment and permitting processes, Indigenous and community engagement, and ESG strategy for various projects, and has provided due diligence and assurance services to companies such as Centerra Gold, Yamana Gold, and Alamos Gold. As a Professional Agrologist, he is recognized for his ability to navigate complex regulatory environments and deliver large-scale projects.
AI Analysis | Feedback
The key risks to Gold X2 Mining (AUXX) are:
- Exploration and Development Success Uncertainty: Gold X2 Mining is a junior mineral exploration company that does not currently own any producing properties. Its future viability is heavily dependent on the success of its exploration activities in leading to economically viable mineral deposits and the company's ability to advance these projects through to development. There is no guarantee that exploration efforts will result in the discovery of commercial quantities of gold, or that any discovered deposits can be economically developed.
- Financing and Capital Raising Risk: As a company without revenue-generating operations, Gold X2 Mining's business activities, including ongoing exploration and potential development of its Moss Gold Project, require substantial capital. There is a significant risk that the company may not be able to secure adequate financing on favorable terms, or at all, to continue its operations. The company primarily funds its activities through equity financings.
- Commodity Price Volatility Risk: Gold X2 Mining is a gold-focused company, and thus the profitability and overall value of its projects are directly tied to the fluctuating market price of gold. Gold prices are subject to global economic, political, and speculative factors, which are beyond the company's control. Significant declines in gold prices could negatively impact the economic viability of its projects and its financial performance.
AI Analysis | Feedback
AI Analysis | Feedback
AI Analysis | Feedback
Here are 3-5 expected drivers of future revenue growth for Gold X2 Mining (symbol: AUXX) over the next 2-3 years:
- Advancement of the Moss Gold Project to Commercial Production: Gold X2 Mining Inc. is currently an exploration and development company with no producing properties, focused entirely on its 100%-owned Moss Gold Project in Ontario, Canada. The primary driver of future revenue growth will be the successful advancement of this project through permitting, construction, and ultimately into commercial gold production. The company's activities are centered on moving this asset toward potential development.
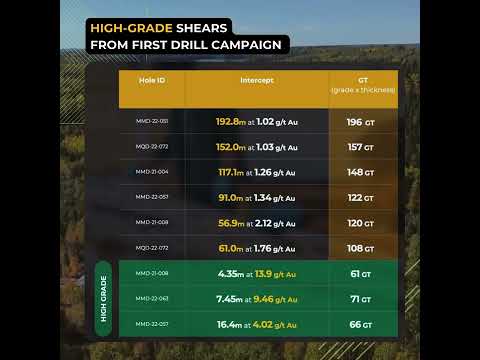
- Successful Expansion and Upgrade of Mineral Resources: Continued positive drilling results that expand the known gold resource and upgrade its classification (e.g., from inferred to indicated or measured) at the Moss Gold Project are critical. Recent drilling has identified wider gold-bearing zones, contributing to the overall understanding and potential size of the resource. An enlarged and higher-confidence mineral resource base underpins a more robust and economically viable mine plan.
- Positive Economic Studies and De-risking the Project: The completion of favorable Preliminary Economic Assessments (PEA), Pre-Feasibility Studies (PFS), and ultimately a Feasibility Study (FS) for the Moss Gold Project will be a significant driver. These studies demonstrate the project's economic viability, projected costs, and potential returns, which are crucial for attracting further investment and de-risking the development path towards revenue generation.
- Securing Development Capital and Strategic Partnerships: As an exploration company primarily funded through equity financings, securing the substantial capital required for the construction and infrastructure development of a mine at the Moss Gold Project is essential. This could involve debt financing, further equity raises, or strategic partnerships with larger mining companies that can provide capital, expertise, and a pathway to production.
- Favorable Gold Price Environment: While external to the company's direct operations, a sustained strong or increasing price for gold will significantly enhance the economic attractiveness of the Moss Gold Project. Higher gold prices improve project profitability, making it more appealing for development and potentially accelerating the timeline to production, thereby impacting future revenues.
AI Analysis | Feedback
Capital Allocation Decisions for Gold X2 Mining (AUXX)
Share Issuance
- On July 29, 2026, Gold X2 Mining completed a 6-for-1 share consolidation, reducing the number of issued and outstanding common shares to approximately 101,110,094.
- Effective September 8, 2026, Gold X2 Mining commenced trading on the NYSE American under the symbol "AUXX" following its 6:1 share consolidation, which is expected to broaden its investor base and increase visibility within U.S. capital markets.
- On October 27, 2026, Gold X2 Mining announced definitive agreements to spin out a 1.0% net smelter return (NSR) royalty on its Moss Gold Project to a new subsidiary, "SpinCo," with existing shareholders receiving one-fifth of one SpinCo share for each Gold X2 share held.
Inbound Investments
- Gold X2 Mining is backed by a Canadian private equity firm.
- As of October 20, 2026, SS3H Ventures LLC reported beneficial ownership of 7,933,332 shares, representing a 7.54% stake in Gold X2 Mining.
Capital Expenditures
- Gold X2 Mining reported annual capital expenditures of $7.73 million in 2025, $340.285K in 2024, and $20.088 million in 2023.
- The company invested over $100 million of new capital and completed approximately 100,000 meters of drilling on the Moss Gold Project as of January 26, 2026.
- Gold X2 Mining is undertaking an ongoing 160,000-meter drill program at the Moss Gold Project, with 99,257 meters completed as of September 15, 2026, primarily focused on resource expansion, resource development, and near-mine exploration.
Research & Analysis
Invest in Strategies
Wealth Management
Peer Comparisons
| Peers to compare with: |
Financials
| Median | |
|---|---|
| Name | |
| Mkt Price | 24.05 |
| Mkt Cap | 9.4 |
| Rev LTM | 2,411 |
| Op Inc LTM | 971 |
| FCF LTM | 58 |
| FCF 3Y Avg | 26 |
| CFO LTM | 622 |
| CFO 3Y Avg | 609 |
Growth & Margins
| Median | |
|---|---|
| Name | |
| Rev Chg LTM | 69.5% |
| Rev Chg 3Y Avg | 31.8% |
| Rev Chg Q | 47.5% |
| QoQ Delta Rev Chg LTM | 8.1% |
| Op Inc Chg LTM | 90.0% |
| Op Inc Chg 3Y Avg | 63.2% |
| Op Mgn LTM | 52.4% |
| Op Mgn 3Y Avg | 38.2% |
| QoQ Delta Op Mgn LTM | 1.4% |
| CFO/Rev LTM | 42.1% |
| CFO/Rev 3Y Avg | 39.6% |
| FCF/Rev LTM | 7.0% |
| FCF/Rev 3Y Avg | 2.6% |
Price Behavior
| Market Price | $3.91 | |
| Market Cap ($ Bil) | 0.4 | |
| Distance from 52W High | -47.8% | |
| 50 Days | 200 Days | |
| DMA Price | ||
| DMA Trend | ||
| Distance from DMA | ||
| 3M | 1YR | |
| Volatility | 60.2% | 60.2% |
| Downside Capture | ||
| Upside Capture | ||
| Correlation (S&P 500) |
| 1M | 2M | 3M | 6M | 1Y | 3Y | |
|---|---|---|---|---|---|---|
| Beta | 1.92 | 1.15 | -0.17 | -0.16 | 1.02 | -0.94 |
| Up Beta | 4.74 | 1.24 | -0.61 | -2.13 | -0.38 | 1.33 |
| Down Beta | 0.56 | 0.98 | -1.03 | 1.04 | -2.37 | 1.42 |
| Up Capture | 25% | -30% | -18% | -7% | -3% | -0% |
| Bmk +ve Days | 12 | 18 | 28 | 62 | 130 | 427 |
| Stock +ve Days | 8 | 11 | 11 | 11 | 11 | 11 |
| Down Capture | 348% | 389% | 308% | 158% | 92% | 54% |
| Bmk -ve Days | 10 | 25 | 36 | 64 | 121 | 325 |
| Stock -ve Days | 14 | 26 | 26 | 26 | 26 | 26 |
[1] Upside and downside betas calculated using positive and negative benchmark daily returns respectively
Based On 1-Year Data
| Annualized Return | Annualized Volatility | Sharpe Ratio | Correlation with AUXX | |
|---|---|---|---|---|
| AUXX | -47.9% | 60.2% | -6.22 | - |
| Sector ETF (XLB) | 25.3% | 18.2% | 1.08 | 33.2% |
| Equity (SPY) | 9.5% | 13.6% | 0.41 | 27.4% |
| Gold (GLD) | 3.6% | 28.7% | 0.11 | 55.6% |
| Commodities (DBC) | 37.7% | 21.2% | 1.40 | -27.7% |
| Real Estate (VNQ) | 12.0% | 14.2% | 0.55 | 44.7% |
| Bitcoin (BTCUSD) | -20.8% | 43.3% | -0.42 | 32.1% |
Smart multi-asset allocation framework can stack odds in your favor. Learn How
Based On 5-Year Data
| Annualized Return | Annualized Volatility | Sharpe Ratio | Correlation with AUXX | |
|---|---|---|---|---|
| AUXX | -12.2% | 60.2% | -6.22 | - |
| Sector ETF (XLB) | 6.1% | 19.2% | 0.20 | 33.2% |
| Equity (SPY) | 11.3% | 17.3% | 0.48 | 27.4% |
| Gold (GLD) | 17.5% | 19.1% | 0.74 | 55.6% |
| Commodities (DBC) | 8.0% | 19.6% | 0.29 | -27.7% |
| Real Estate (VNQ) | 1.2% | 18.9% | -0.05 | 44.7% |
| Bitcoin (BTCUSD) | 5.9% | 51.5% | 0.29 | 32.1% |
Smart multi-asset allocation framework can stack odds in your favor. Learn How
Based On 10-Year Data
| Annualized Return | Annualized Volatility | Sharpe Ratio | Correlation with AUXX | |
|---|---|---|---|---|
| AUXX | -6.3% | 60.2% | -6.22 | - |
| Sector ETF (XLB) | 10.5% | 20.7% | 0.45 | 33.2% |
| Equity (SPY) | 14.9% | 18.0% | 0.70 | 27.4% |
| Gold (GLD) | 12.0% | 16.5% | 0.59 | 55.6% |
| Commodities (DBC) | 7.6% | 18.1% | 0.33 | -27.7% |
| Real Estate (VNQ) | 5.7% | 20.7% | 0.23 | 44.7% |
| Bitcoin (BTCUSD) | 61.3% | 66.2% | 1.01 | 32.1% |
Smart multi-asset allocation framework can stack odds in your favor. Learn How
Gold X2 Mining — Investor Video Playlist







Industry Resources
| Materials Resources |
| Chemical & Engineering News (C&EN) |
| Mining.com |
| Plastics News |
| Gold Resources |
| Kitco News |
| World Gold Council |
| Mining Journal |
External Quote Links
| Y Finance | Barrons |
| TradingView | Morningstar |
| SeekingAlpha | ValueLine |
| Motley Fool | Robinhood |
| CNBC | Etrade |
| MarketWatch | Unusual Whales |
| YCharts | Perplexity Finance |
| FinViz |
Prefer one of these to Trefis? Tell us why.