
What If You Add Gold And Cash To A Dividend Portfolio?
Part of our series on building a mix that lasts. Start here: is 60/40 dead?
Here’s the short answer. In the nine and a half years we tested, adding gold and cash to a dividend-and-index portfolio gave you more return than 60/40 and a much smaller loss in 2022, the year bonds let everyone down. We’ll show you exactly where that came from, piece by piece. But the more useful question is a quieter one: how many different kinds of bad year can your money survive, and how much are you paying for that insurance? We’ll come back to that, with a number you can write down this weekend.
“Cash feels safe. After inflation, it often isn’t.” – Anonymous
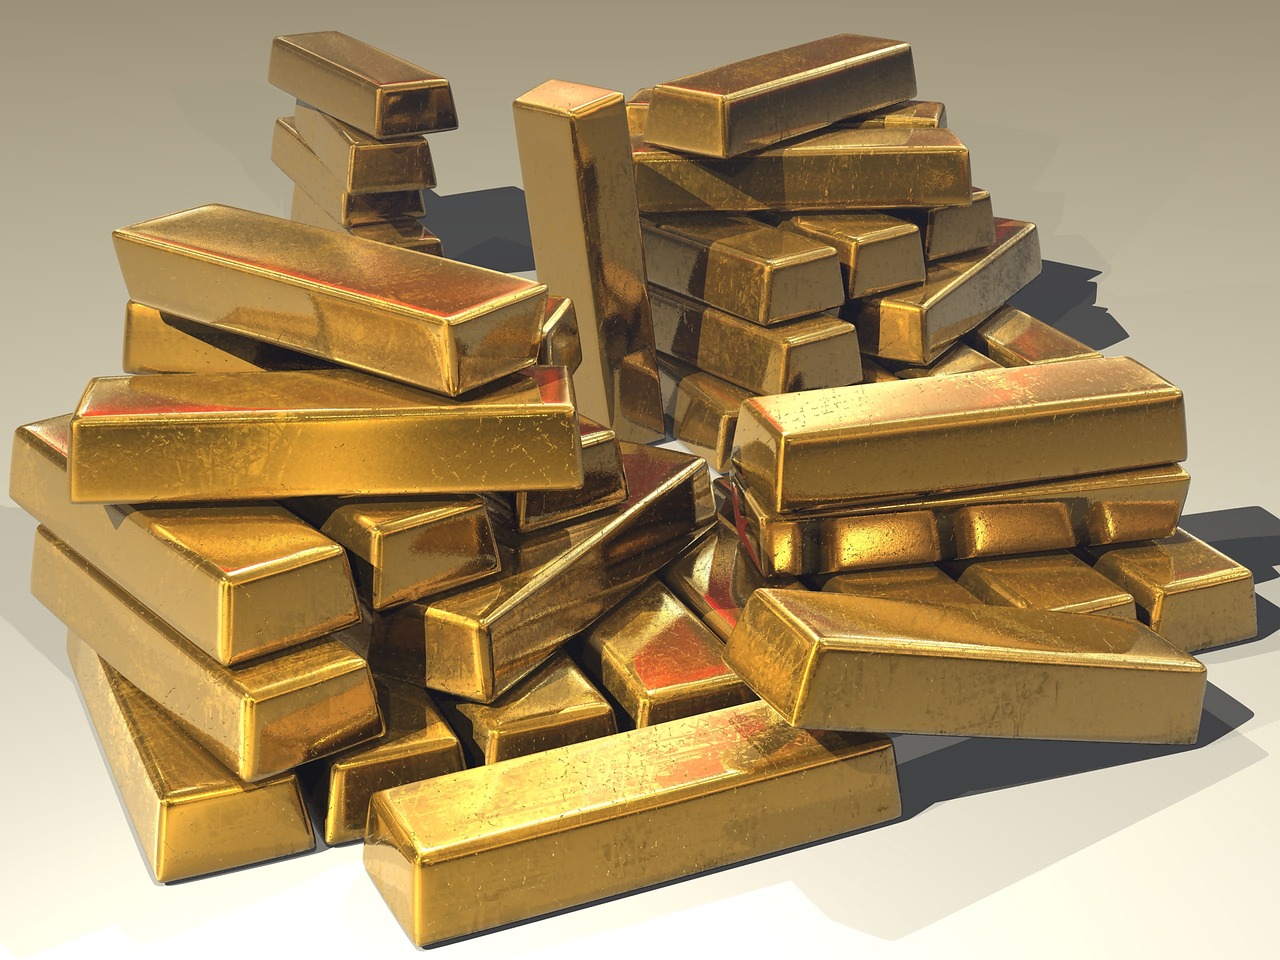
What Does Everyone Already Know?
That 60/40, six parts stocks to four parts bonds, is the plan a lot of retirement money runs on. This series starts from its one blind spot: it works in a growth scare like 2008 and fails in an inflation scare like 2022, when stocks and bonds fell together.
Everyone also knows the usual reputations. Gold is the thing your uncle keeps for the end of the world. Cash is what you hold when you’re scared. Dividend stocks are for retirees. Each of those is half true, and the half that’s true is exactly why they can be useful together.
So What Happens When You Add Gold And Cash?
We ran the mixes from April 2017 to October 2026, rebalanced every month. The “S&P” part of each mix is the S&P 500 fund (SPY), standing in for a growth sleeve. The “Income” part is the Trefis Income Solution model, before fees. Gold is GLD, cash is the T-bill fund BIL, bonds are AGG.
| Mix | A year | Worst drop | 2022 |
|---|---|---|---|
| 100% S&P 500 | 14.6% | −23.9% | −18.2% |
| 60/40 | 9.5% | −20.0% | −15.8% |
| 40 Income / 40 S&P / 20 bonds | 11.5% | −17.0% | −8.9% |
| 40 Income / 40 S&P / 10 gold / 10 cash | 12.8% | −15.1% | −6.2% |
| 30 Income / 30 S&P / 20 bonds / 10 gold / 10 cash | 10.3% | −14.4% | −7.1% |
The gold-and-cash mix earned about 3 points a year more than 60/40 and lost about 10 points less in 2022. The first two rows are measured; the rest include the Income Solution model.
In dollars, on $100,000, that 2022 gap is the difference between a loss of about $15,800 and a loss of about $6,200. That’s the year a lot of people changed their plans at the worst moment, and the smaller number is far easier to sit through.
Is It The Gold And Cash, Or The Dividends?
Fair question, because the dividend sleeve did a lot of the lifting: the Income Solution model was up 2.9% in 2022 while the S&P 500 fell 18.2%. So compare rows three and four of the table. Same 40 Income and 40 S&P; the only change is the last 20%. With bonds there, the mix earned 11.5% a year and lost 8.9% in 2022. With gold and cash, 12.8% and 6.2%. So about 1.3 points a year, and about 2.7 points of the 2022 cushion, came from gold and cash doing what bonds couldn’t.
Here’s what each piece did in the three years the S&P 500 fund lost money since 2005:
| Fund | 2008 | 2018 | 2022 |
|---|---|---|---|
| SPY stocks | −36.8% | −4.6% | −18.2% |
| AGG bonds | +8.3% | +0.1% | −13.0% |
| GLD gold | +4.9% | −1.9% | −0.8% |
| BIL cash | +1.6% | +1.7% | +1.4% |
Bonds saved 60/40 in 2008 and sank it in 2022. Gold and cash held roughly flat in all three.
What Do The Dividend Payers Bring?
The Income Solution itself holds 50 companies with ten straight years of dividends, no cut in the past year and a top-half yield, weighted by size with no more than 5% in any one. It yields about 3.0% today, roughly three times the S&P 500. To see what that kind of company looks like up close, here are five big, long-record dividend payers on Trefis company data, with how far each fell in 2022 and what it did on Thursday:
| Company | Dividend · FCF yield | 2022 worst fall | Thursday |
|---|---|---|---|
| Coca-Cola | 2.2% · 3.5% | −17% | −0.1% |
| Procter & Gamble | 2.6% · 3.9% | −24% | −0.1% |
| PepsiCo | 4.1% · 5.4% | −12% | +0.2% |
| AbbVie | 2.3% · 3.7% | −22% | −2.2% |
| Altria | 5.6% · 7.1% | −26% | −0.6% |
| SPY | 1.0% · n/a | −24% | −4.4% |
Each of them brings in more free cash than it pays out, and on Thursday all five did far better than the index.
The 2022 column is a useful reminder: dividend stocks aren’t bonds, and several fell about as far as the index that year. What they did differently is pay you while you waited and hold up on the days the AI trade sold off. Thursday was one of those: the AI trade unwinding, with chips, power and data-center builders falling hardest, amid worries about the power bottleneck and growing data-center opposition. SPY fell 4.4% to $733.00, while the 50 Income Solution holdings, at their October 31 weights, fell 1.5%.
These five are examples of the kind of company the screen looks for, not a list of the model’s holdings, which change.
Where Did The Edge Actually Come From?
Here’s the part that surprised us. In months when the S&P 500 fell, 60/40 lost about 66 cents for every dollar the index lost, and the gold-and-cash mix about 65 cents, almost the same. The difference was in the good months: 60/40 kept about 66 cents of every dollar the index made, and the gold-and-cash mix about 75 cents. It didn’t fall much less month to month. It climbed back faster, because dividend stocks and gold keep growing where bonds and cash mostly just pay interest.
How Low Can Each Piece Go?
Calendar years flatter everything. Inside each crisis, peak to bottom, the record is rougher. Here’s the worst fall for each fund in the last three big selloffs, and when it got back to its old high, from daily prices with dividends:
| Fund | 2008 | 2020 | 2022 |
|---|---|---|---|
| SPY stocks | −55% · Aug 2012 | −34% · Aug 2020 | −24% · Dec 2023 |
| AGG bonds | −13% · Dec 2008 | −10% · May 2020 | −16% · Sep 2025 |
| GLD gold | −29% · Sep 2009 | −13% · Apr 2020 | −21% · Dec 2023 |
| BIL cash | −1% | 0% | 0% |
Gold ended 2008 up, but fell 29% on the way, from March to November. Only cash never really fell.
And gold has its own bad decade. From its August 2011 high to December 2015, GLD fell about 46%, and it didn’t get back above that high until July 2020, nearly nine years later. That’s why it’s 10%, not 40%. We look at gold’s longer record, and what it says about your dollar gains, in our piece on why the S&P 500 is up 75% in 3 years but down 14% priced in gold.
What Does It Give Up?
It trails a plain index fund in a strong market. 100% S&P 500 earned 14.6% a year over the same window, about 1.8 points more. The Income Solution trailed the S&P 500 in 6 of 10 calendar years; in 2023 it made 1.4% while the index made 26.2%. If you’d regret missing rallies more than you’d regret a 2022, the plain fund may suit you better.
Cash often lags inflation over time. That’s the quote above. From 2009 to 2021, BIL earned close to nothing most years. Cash here is a small, fixed slice with a job: something to rebalance from when stocks are down. It isn’t a place to hide.
And the test itself has limits. It starts in 2017, so it has lived through one 2022 and no 2008. The Income part is a model, before fees. Treat these as a measured history, not a promise.
What Should You Do This Week?
1. Price your own mix in 2022 and write the number down. Not the percent, the dollars. If your 2022 loss on today’s balance would be more than you could sit through, that’s the first thing to fix.
2. Ask what fills the slot after stocks. If it’s only bonds, you’re covered for one kind of bad year. A small fixed slice of gold and a small fixed slice of cash can cover the other kind, as they did in 2022.
3. Set it by rule, then rebalance on a schedule. Pick the percentages on a quiet weekend, not after a 4% day. Days like Thursday are when a written rule keeps you from guessing.
What this replaces: piling into gold after a big run, or parking everything in cash after a scare. Both are reactions. A fixed slice, rebalanced, is a plan. The risk: in a long, straight-up market a mix like this lags, and gold can go years without helping.
What’s The Bigger Idea?
We call it Exposure hides in plain sight. Four sleeves aren’t safer because there are four of them. They’re safer only if they fail at different times. In 2022, stocks and bonds failed together; dividend payers, gold and cash didn’t. Know which kind of trouble each piece of your money covers, and size each one so that no single kind of year can sink the plan.
Gold and cash earned their place, in small, fixed slices. From 2017 to 2026, 40 Income / 40 S&P 500 / 10 gold / 10 cash earned 12.8% a year against 9.5% for 60/40 and lost 6.2% in 2022 against 15.8% (model, before fees). In the S&P 500’s three losing years since 2005, gold and cash held roughly flat while bonds failed once. It lags strong rallies, and gold once took nine years to recover. Write down your own 2022 dollar loss, pick your slices by rule, and rebalance on a schedule.
What Should You Ask Next?
- Are dividends the new bonds? What a ten-year dividend record is worth next to a coupon.
- Bonds now pay more than stocks. Does that change what 60/40 is buying?
Follow this story with us: we’ll keep running these mixes as the year closes and tell you which ones held up.
Which Kinds Of Bad Year Is Your Mix Built For?
The dividend sleeve in these mixes is the Trefis Income Solution: 50 dividend payers with ten straight years of dividends, yielding about 3% today. If you have $1 million or more invested, have a Trefis expert partner advisor test your mix in 2008 and 2022 for a second opinion in a free 15-minute call, or let Invest With Trefis build and run it for you.
For questions about this article or underlying research, email help@trefis.com.