How Low Can Home Depot Stock Go?
To accurately assess risk, investors must look at how an asset behaves when the system breaks. In the 15 major market dislocations since it began trading, Home Depot (NYSE: HD) has averaged a -17% contraction, compared to the S&P 500’s -16% drop.
If you are an investor in HD stock, you might be asking: if the macroeconomic environment fractures, how far can this stock actually fall?
To answer this, we must analyze how the retail giant has performed during past market crashes, mapping its specific financial and structural vulnerabilities to systemic shocks.

Image by Steve Buissinne from Pixabay
The Vulnerability: Fixed Footprints And Consumer Wallets
As a brick-and-mortar giant, Home Depot’s valuation multiples are deeply tied to housing health and consumer discretionary spending. Operating a massive physical retail footprint requires immense operational efficiency, making the company highly sensitive to sudden demand scares. If consumer wallets pinch, the risk is not a standard cooling period, but a fundamental reassessment of the stock’s near-term growth thesis.
This systemic dependency is shared across its peer group. Direct competitors like Lowe’s (NYSE: LOW) face identical pressures on big-ticket DIY spend, while retail giants like Walmart (NASDAQ: WMT) and Target (NYSE: TGT) compete for the remaining home décor dollars. For a parallel look at sector vulnerability, our sibling analysis, How Low Can Lowe’s Stock Go?, maps how these same cyclical forces impact Lowe’s baseline.
When macro plumbing freezes, this inherent vulnerability manifests sharply in the data.
Historical Case Studies: Credit, Liquidity, And Black Swans
Historically, Home Depot exhibits tight downside capture when systemic crises hit, though its resilience varies depending on the economic shock.
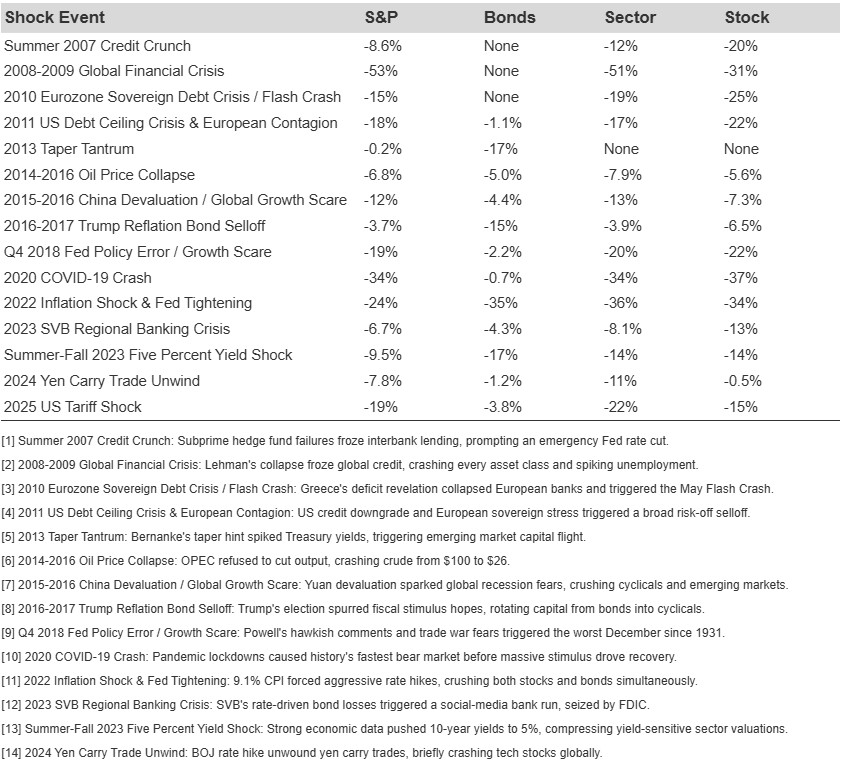
During the 2008 Global Financial Crisis, the unwinding of excess housing leverage froze global financial plumbing overnight. Because its core business sits directly downstream from the housing market, Home Depot was acutely exposed. Yet, proving its structural resilience relative to a broken market, HD absorbed a -31% drawdown compared to a staggering -53% destruction for the S&P 500.
Sovereign risks can inflict different pain. During the 2010 Eurozone Sovereign Debt Crisis and Flash Crash, Greece’s deficit revelation triggered systemic panic. This macro shock resulted in a -25% drawdown for HD, compounding a much sharper hit than the S&P 500’s -15% correction.
During the 2020 COVID-19 Crash, pandemic fears triggered the fastest bear market in history. Despite an eventual V-shaped recovery fueled by stimulus, HD stock absorbed a painful -37% drawdown during the initial panic, marginally underperforming the S&P 500’s -34% drop, while bonds cushioned the blow at just -0.7%.
Historical Drawdown Analysis: 15 Core Market Disruptions
Actionable Risk Mitigation
While headline panic over macroeconomic shocks is deafening, letting fear dictate your trades leaves your portfolio exposed. Drawdowns of this magnitude are standard features of Home Depot’s historical profile. If your underlying investment thesis remains intact, this steep price contraction should be viewed as a mechanical market discount, not a structural breakdown.
Navigating this cyclical sector requires a broader strategy anchored by resilient assets. The High Quality (HQ) Portfolio is designed to outperform the market by limiting the impact of severe shocks, delivering over 105% returns since inception. Managing extreme volatility with a diversified approach ensures a single macroeconomic shift does not derail your holdings.