Q3 2015 U.S. Investment Bank Round-Up: Equity Underwriting

Global equity capital markets witnessed a sharp reduction in activity for the third quarter of the year, as many companies were forced to put off plans to raise money through stock issuances in response to sharp sell-offs across stock exchanges worldwide. [1] The lower volume of global IPOs and follow-on stock offerings stood out in particular due to the exceptionally strong showing over the first two quarters of the year, which was the best ever six-month period for equity underwriting activity. This lower volume weighed on the equity underwriting fees reported by investment banks for the quarter.
Last month, we detailed the overall performance of the country’s largest investment banks in the global equity capital markets for Q3 2015 as a part of our article Dismal Equity Capital Market Activity Levels In Q3 Hurt Bank Underwriting Fees. Using equity market data compiled by Thomson Reuters, we concluded that the equity underwriting fees for these banks would fall considerably quarter-on-quarter as well as year-on-year. In this follow-up article, we look at the actual fees reported by the investment banks – Goldman Sachs (NYSE:GS), JPMorgan (NYSE:JPM), Morgan Stanley (NYSE:MS), Bank of America-Merrill Lynch (NYSE:MS) and Citigroup (NYSE:C) – and highlight the trends that emerge on a side-by-side comparison of these figures. See the full Trefis analysis for Goldman Sachs | JPMorgan | Morgan Stanley | Bank of America | Citigroup
The global equity market saw companies around the world raise just $141 billion through IPOs and follow-on offerings over the third quarter of the year. The total deal size figure represents a decrease of 36% compared to the figure for Q2 2014, and is roughly half of what the industry witnessed in the previous quarter. The decrease in total deal size for the third quarter was primarily due to a reduction in the total number of deals, with the number of deals falling to the lowest level in more than three years. As the fee revenues for investment banks depend on the size as well as the number of deals they participate in, the third quarter was expected to be an unusually weak period in terms of revenues. Thomson Reuters’ data estimated that equity underwriting fees for the industry as a whole were roughly 60% lower in Q3 2015 compared to Q2 2015.
- Morgan Stanley Stock Dropped 5% Yesterday, What To Expect?
- Trailing S&P500 By 31% Since The Start Of 2023, Will Morgan Stanley Stock Close The Gap?
- Up 10% In The Last One Month, What’s Next For Morgan Stanley Stock?
- Where Is Morgan Stanley Stock headed?
- What To Expect From Morgan Stanley Stock?
- What To Expect From Morgan Stanley Stock?
The table below was compiled based on the banks’ earnings announcements, and shows how much in equity underwriting fees each of the five banks earned for each of the last seven quarters.
| (in $ mil) | Q1’14 | Q2’14 | Q3’14 | Q4’14 | Q1’15 | Q2’15 | Q3’15 |
| JPMorgan | 353 | 477 | 414 | 327 | 399 | 452 | 269 |
| Morgan Stanley | 315 | 489 | 464 | 345 | 307 | 489 | 250 |
| Goldman Sachs | 437 | 545 | 426 | 342 | 533 | 595 | 190 |
| Bank of America | 313 | 514 | 315 | 348 | 345 | 417 | 188 |
| Citigroup | 299 | 397 | 298 | 252 | 231 | 296 | 169 |
| Total | 1,717 | 2,422 | 1,917 | 1,614 | 1,815 | 2,249 | 1,066 |
The notable reduction in revenues for each of the largest U.S. investment banks stands out in the table above. Among these banks, JPMorgan reported the highest equity underwriting fees – just the third time in the last twelve quarters that the diversified banking giant has achieved this feat (besides Q2 2013 and Q3 2013). JPMorgan’s revenues fell 40% compared to Q2 2013, which was the lowest quarter-on-quarter reduction among these banks. Morgan Stanley came in a close second, with revenues shrinking almost 50% sequentially. Goldman Sachs had a particularly weak quarter, with revenues falling below $200 million for the first time since late 2012 – less than one-third the figure for the previous quarter.
Taken together, the five largest banks earned less than $1.1 billion in equity underwriting fees in Q3 2015 – a 53% reduction sequentially and a 44% decline year-on-year. This made the period the worst quarter for these banks in this regard since Q3 2012. Notably, the quarter-on-quarter reduction is largely in line with the 60% decrease estimated by Thomson Reuters for the industry as a whole, with the overall figure faring slightly better due to a better-than-average showing by JPMorgan.
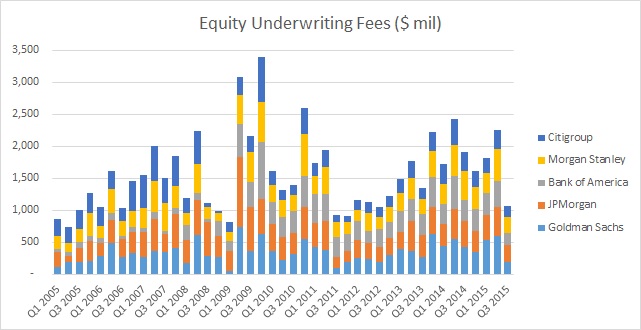
The chart below provides a snapshot of quarterly equity underwriting fees for each of these five banks since early 2005, and makes it easy to identify trends in these revenues over the last decade.
View Interactive Institutional Research (Powered by Trefis):
Global Large Cap | U.S. Mid & Small Cap | European Large & Mid Cap
More Trefis Research
- Global Equity Capital Markets Q3 2015, Thomson Reuters Deals Intelligence [↩]