How Will Yum! Brands Stock React To Its Upcoming Earnings?

Yum! Brands (NYSE: YUM) is the company behind Taco Bell, KFC, Pizza Hut, and Habit Burger & Grill. It is set to report its second-quarter earnings on Tuesday, August 5, 2025, with analysts projecting earnings of $1.46 per share on $1.94 billion in revenue. This would represent a 12% year-over-year increase in earnings and a 10% growth in sales compared to the prior year’s figures of $1.30 per share and $1.76 billion in revenue. Historically, YUM stock has shown a tendency to outperform following earnings announcements, having increased 63% of the time with a median one-day rise of 1.9% and a maximum observed increase of 10%.
Yum! Brands posted a strong Q1, driven by solid earnings growth and momentum at Taco Bell and KFC. Despite a slight revenue miss, profitability held firm and digital sales continued to grow. While U.S. demand and Pizza Hut softness warrant caution, long-term growth targets remain intact. The company has $41 Bil in current market capitalization. Revenue over the last twelve months was $7.7 Bil, and it was operationally profitable with $2.4 Bil in operating profits and net income of $1.4 Bil. While a lot will depend on how results stack up against consensus and expectations, understanding historical patterns might just turn the odds in your favor if you are an event-driven trader.
For event-driven traders, historical patterns may offer an edge, whether by positioning ahead of earnings or reacting to post-release moves. That said, if you seek upside with lower volatility than from individual stocks, the Trefis High Quality portfolio presents an alternative, having outperformed the S&P 500 and generated returns exceeding 91% since its inception. See earnings reaction history of all stocks.

Historical Odds Of Positive Post-Earnings Return
Some observations on one-day (1D) post-earnings returns:
- There are 19 earnings data points recorded over the last five years, with 12 positive and 7 negative one-day (1D) returns observed. In summary, positive 1D returns were seen about 63% of the time.
- However, this percentage decreases to 58% if we consider data for the last 3 years instead of 5.
- Median of the 12 positive returns = 1.9%, and median of the 7 negative returns = -1.7%
Additional data for observed 5-Day (5D), and 21-Day (21D) returns post earnings are summarized along with the statistics in the table below.
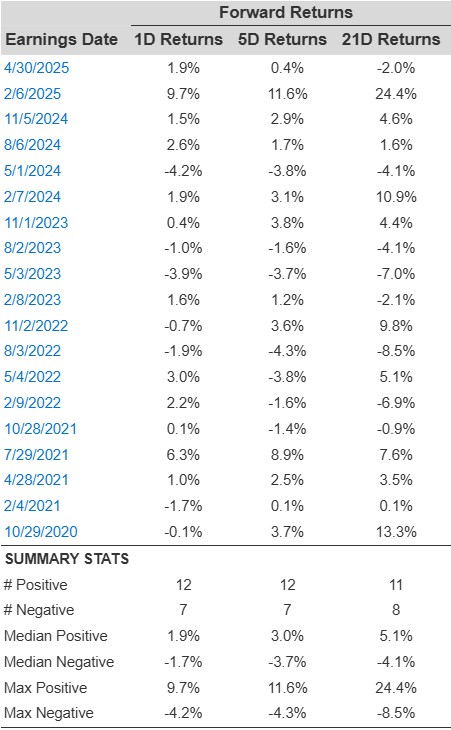
YUM 1D, 5D, and 21D Post Earnings Return
Correlation Between 1D, 5D, and 21D Historical Returns
A relatively less risky strategy (though not useful if the correlation is low) is to understand the correlation between short-term and medium-term returns post earnings, find a pair that has the highest correlation, and execute the appropriate trade. For example, if 1D and 5D show the highest correlation, a trader can position themselves “long” for the next 5 days if 1D post-earnings return is positive. Here is some correlation data based on 5-year and 3-year (more recent) history. Note that the correlation 1D_5D refers to the correlation between 1D post-earnings returns and subsequent 5D returns.
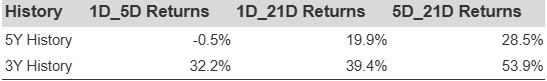
YUM Correlation Between 1D, 5D and 21D Historical Returns
Is There Any Correlation With Peer Earnings?
Sometimes, peer performance can have influence on post-earnings stock reaction. In fact, the pricing-in might begin before the earnings are announced. Here is some historical data on the past post-earnings performance of Yum Brands stock compared with the stock performance of peers that reported earnings just before Yum Brands. For fair comparison, peer stock returns also represent post-earnings one-day (1D) returns.

YUM Correlation With Peer Earnings
Learn more about Trefis RV strategy that has outperformed its all-cap stocks benchmark (combination of all 3, the S&P 500, S&P mid-cap, and Russell 2000), to produce strong returns for investors.
Invest with Trefis Market-Beating Portfolios