What To Expect From Wal-Mart’s Q1

Wal-Mart (NYSE:WMT) is scheduled to report its first quarter results on Thursday, May 17. The company had a fairly strong 2017 as its performance was mostly above its guidance and market expectations. We have created an Interactive Dashboard which outlines our forecasts for the company’s Q1 results. You can modify our forecasts to see the impact any changes would have on the company’s earnings and valuation.
- Where Is Walmart Stock Headed Post Stock Split?
- Up 7% Already This Year , Where Is Walmart Stock Headed Post Q4 Results?
- Up 18% This Year, Will Walmart Stock Continue To Grow Past Q3?
- Can Walmart’s Stock Trade Lower Post Q2?
- Walmart Stock Likely To See Little Movement Post Q1
- Walmart Stock To Trade Lower Post Q3 Results?
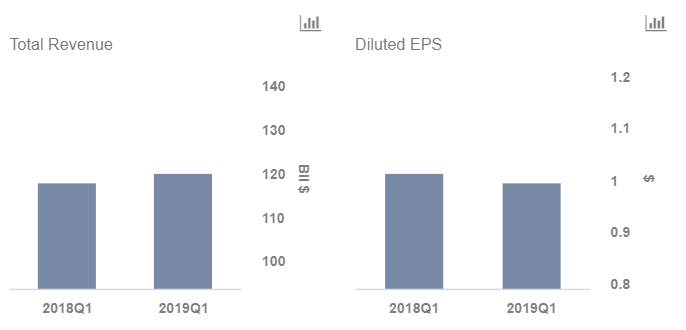
Growth In Revenue, Pressure On Bottom Line
In fiscal 2018, the retailer’s total revenue increased 3% year-over-year (y-o-y) to $500 billion, driven by 3% y-o-y growth in the U.S. business. Wal-Mart’s net growth was positively impacted by 2.2% overall comparable sales growth, 1.3% year-over-year growth in consolidated retail square feet and sales from recent acquisitions. Going forward, we expect the company’s revenues to grow modestly in the first quarter as well.
However, the company’s operating income declined 10% y-o-y in the fiscal 2018, primarily due to investments in technology and a rise in employee wages. Consequently, the company’s net income also declined 28% y-o-y to $10 billion in the same period, translating into earnings of $3.28 per share. Going forward, we expect the earnings pressure to continue in Q1 based on the aforementioned factors.


Future Outlook
For fiscal 2019, Wal-Mart expects comparable sales growth of at least 2.0% for Wal-Mart U.S. It also expects Sam’s Club (ex. fuel) comparable sales growth to range between 3.0% to 4.0%. In addition, the retailer also posted full-year adjusted earnings per share guidance of $4.75 to $5.00, which is below the $5.13 per share consensus estimate, but 7% to 13% higher than the adjusted EPS of $4.42 in fiscal 2018. The weak guidance from the company is tied partially to an estimated fiscal 2019 tax rate of 24% to 26%, which was higher than some estimates.

For CFOs and Finance Teams | Product, R&D, and Marketing Teams
Like our charts? Explore example interactive dashboards and create your own