How Will Constellation Brands Stock React To Its Upcoming Earnings?

Constellation Brands Inc. (NYSE: STZ) —best known for Corona beer–is scheduled to report its earnings on Monday, October 6, 2025. Historically, the stock (STZ) has often experienced a negative one-day return following its earnings announcements. Over the last five years, 60% of earnings announcements resulted in a negative one-day return for STZ stock. The median of these negative returns was −3.3%, with the maximum one-day negative return reaching −17.1%.
For event-driven traders, while the actual results compared to consensus estimates are paramount, understanding this historical pattern can offer a potential advantage. There are two primary strategies to capitalize on this event:
- Pre-Earnings Positioning: Analyze the historical odds and take a position before the earnings release.
- Post-Earnings Positioning: Examine the correlation between the immediate one-day return and the medium-term returns post-earnings, and then take a position after the results are announced.
For the upcoming report, the consensus estimate is for earnings of $3.42 per share on $2.48 billion in sales. This compares to the year-ago quarter, where the company reported earnings of $4.32 per share on $2.92 billion in sales.
Fundamentally, Constellation Brands currently has a market capitalization of $24 billion. Over the last twelve months, the company generated $10 billion in revenue and was operationally profitable, recording $3.2 billion in operating profits. However, the net income for the same period was $-442 million.
That being said, if you seek an upside with less volatility than holding an individual stock, consider the High Quality Portfolio. It has comfortably outperformed its benchmark—a combination of the S&P 500, Russell, and S&P MidCap indexes—and has achieved returns exceeding 91% since its inception. Why is that? As a group, HQ Portfolio stocks provided better returns with less risk versus the benchmark index; less of a roller-coaster ride, as evident in HQ Portfolio performance metrics. Also, see – What’s Next For CoreWeave Stock?

STZ Stock Historical Odds Of Positive Post-Earnings Return
Some observations on one-day (1D) post-earnings returns:
- There are 20 earnings data points recorded over the last five years, with 8 positive and 12 negative one-day (1D) returns observed. In summary, positive 1D returns were seen about 40% of the time.
- Notably, this percentage increases to 42% if we consider data for the last 3 years instead of 5.
- Median of the 8 positive returns = 1.8%, and median of the 12 negative returns = -3.3%
Additional data for observed 5-Day (5D) and 21-Day (21D) returns post earnings are summarized along with the statistics in the table below.
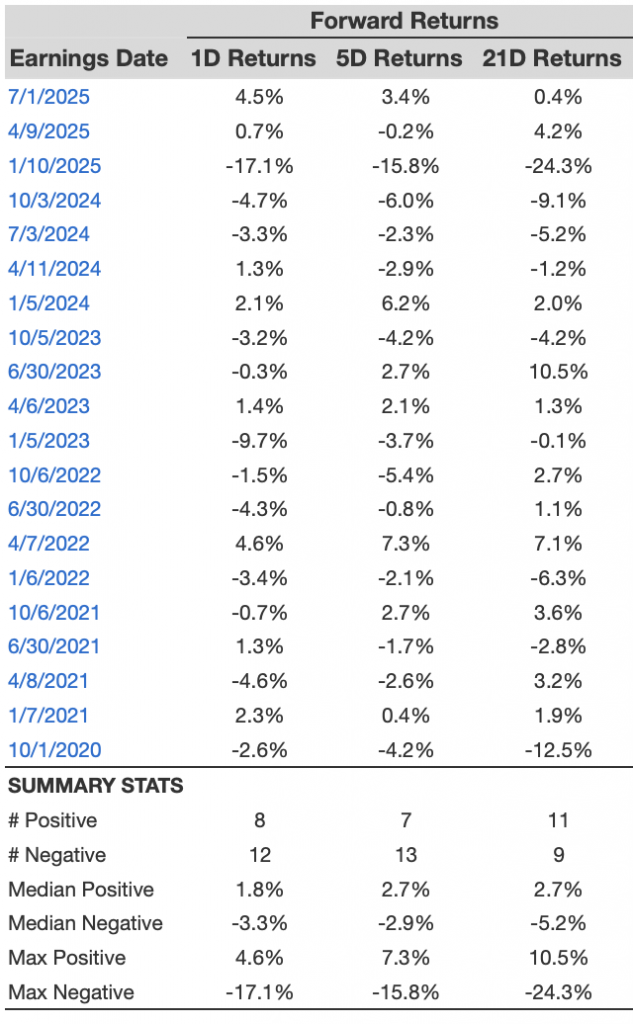
STZ Stock 1D, 5D, and 21D Post Earnings Return
STZ Stock Correlation Between 1D, 5D, and 21D Historical Returns
A relatively less risky strategy (though not useful if the correlation is low) is to understand the correlation between short-term and medium-term returns post earnings, find a pair that has the highest correlation, and execute the appropriate trade. For example, if 1D and 5D show the highest correlation, a trader can position themselves “long” for the next 5 days if the 1D post-earnings return is positive. Here is some correlation data based on a 5-year and a 3-year (more recent) history. Note that the correlation 1D_5D refers to the correlation between 1D post-earnings returns and subsequent 5D returns.
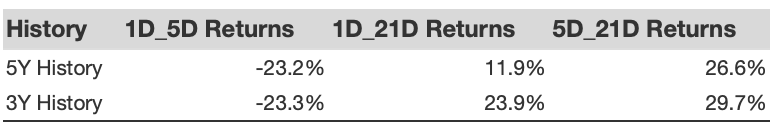
Correlation Between 1D, 5D, and 21D Historical Returns
Investing in a single stock without comprehensive analysis can be risky. Consider the Trefis Reinforced Value (RV) Portfolio, which has outperformed its all-cap stocks benchmark (combination of the S&P 500, S&P mid-cap, and Russell 2000 benchmark indices) to produce strong returns for investors. Why is that? The quarterly rebalanced mix of large-, mid-, and small-cap RV Portfolio stocks provided a responsive way to make the most of upbeat market conditions while limiting losses when markets head south, as detailed in RV Portfolio performance metrics.
Invest with Trefis Market-Beating Portfolios