How Will Constellation Brands Stock React To Its Upcoming Earnings?

Constellation Brands Inc. (NYSE: STZ) —best known for Modelo Especial, Corona Extra, Pacifico, and Robert Mondavi—remains beer-heavy heading into its fiscal Q1 earnings report (February fiscal year) on Wednesday, July 2, 2025. Wall Street expects EPS of $3.33 on $2.56 billion in revenue, down sharply from $4.80 and $2.66 billion a year ago—a 31% drop in earnings and a 4% dip in sales. Historically, STZ has fallen after earnings 60% of the time, with a median one-day drop of 3.3% and a worst-case slide of 17%.
In the fiscal year ended Feb. 28, beer accounted for 84% of sales, or $8.5 billion. The beer division boasted a 40% operating margin, double that of wine and spirits. The company’s recent divestiture aligns with its focus on premium offerings. Fourth-quarter sales rose just 1% to $2.2 billion, but cost cuts helped lift operating income 6%. Management also dialed back its medium-term revenue growth forecast to 2%–4%, down from 6%–8%. With over 98% of sales coming from the U.S., new tariffs could squeeze margins or soften demand if price hikes are needed. That said, the company has $30 Bil in current market capitalization. Revenue over the last twelve months was $10 Bil, and it incurred $350 Mil in operating profits and net income of $-81 Mil.
For event-driven traders, historical patterns may offer an edge, whether by positioning ahead of earnings or reacting to post-release moves. That said, if you seek upside with lower volatility than from individual stocks, the Trefis High Quality portfolio presents an alternative, having outperformed the S&P 500 and generated returns exceeding 91% since its inception. See earnings reaction history of all stocks.

- Get Paid 8.7% to Buy WYNN at a 30% Discount – Here’s How
- What Could Go Wrong With PepsiCo Stock?
- Cash Rich, Low Price – Coursera Stock to Break Out?
- Momentum Meets Value: Sterling Infrastructure Stock Could Be A Good Buy
- Adobe Stock Pullback: A Chance to Ride the Uptrend
- Is Lululemon Athletica Stock Poised for a Rally?
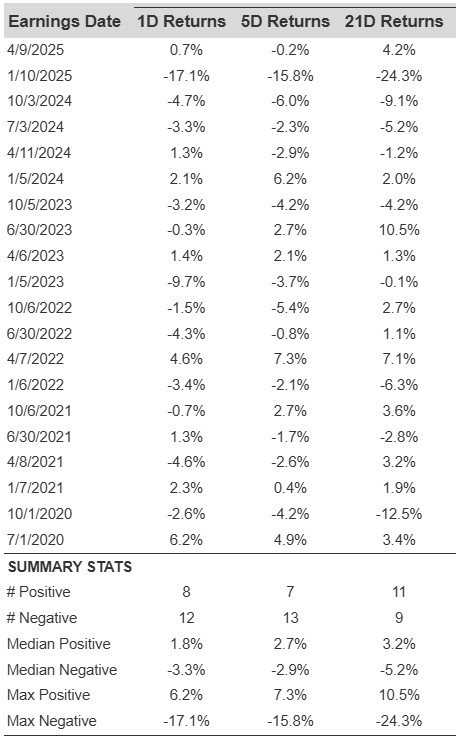
Historical Odds Of Positive Post-Earnings Return
Some observations on one-day (1D) post-earnings returns:
- There are 20 earnings data points recorded over the last five years, with 8 positive and 12 negative one-day (1D) returns observed. In summary, positive 1D returns were seen about 40% of the time.
- However, this percentage decreases to 33% if we consider data for the last 3 years instead of 5.
- Median of the 8 positive returns = 1.8%, and median of the 12 negative returns = -3.3%
Additional data for observed 5-Day (5D), and 21-Day (21D) returns post earnings are summarized along with the statistics in the table below.
Correlation Between 1D, 5D, and 21D Historical Returns
A relatively less risky strategy (though not useful if the correlation is low) is to understand the correlation between short-term and medium-term returns post earnings, find a pair that has the highest correlation, and execute the appropriate trade. For example, if 1D and 5D show the highest correlation, a trader can position themselves “long” for the next 5 days if 1D post-earnings return is positive. Here is some correlation data based on 5-year and 3-year (more recent) history. Note that the correlation 1D_5D refers to the correlation between 1D post-earnings returns and subsequent 5D returns.
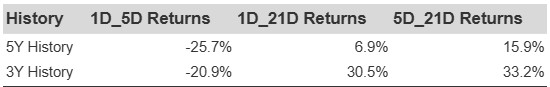
STZ Correlation Between 1D, 5D and 21D Historical Returns
Learn more about Trefis RV strategy that has outperformed its all-cap stocks benchmark (combination of all 3, the S&P 500, S&P mid-cap, and Russell 2000), to produce strong returns for investors.
Invest with Trefis Market-Beating Portfolios