
The Real Signal In SanDisk Stock Was How Bad It Looked

Before the memory chip maker surged over three thousand percent, its financials painted a picture of a business that was messy, unprofitable, and completely misunderstood.
It’s the kind of return that makes you check the ticker twice. Between July 2025 and July 2026, Sandisk stock put on a 3250% gain. A move like that feels like it must have come out of nowhere, a bolt from the blue. But the story of what was about to happen was assembling itself beforehand, not in a clean spreadsheet, but in a messy, contradictory set of facts that most investors ignored.
The evidence presented a counterintuitive picture of a company at a cyclical low, which is precisely where the significant operating leverage was hiding.
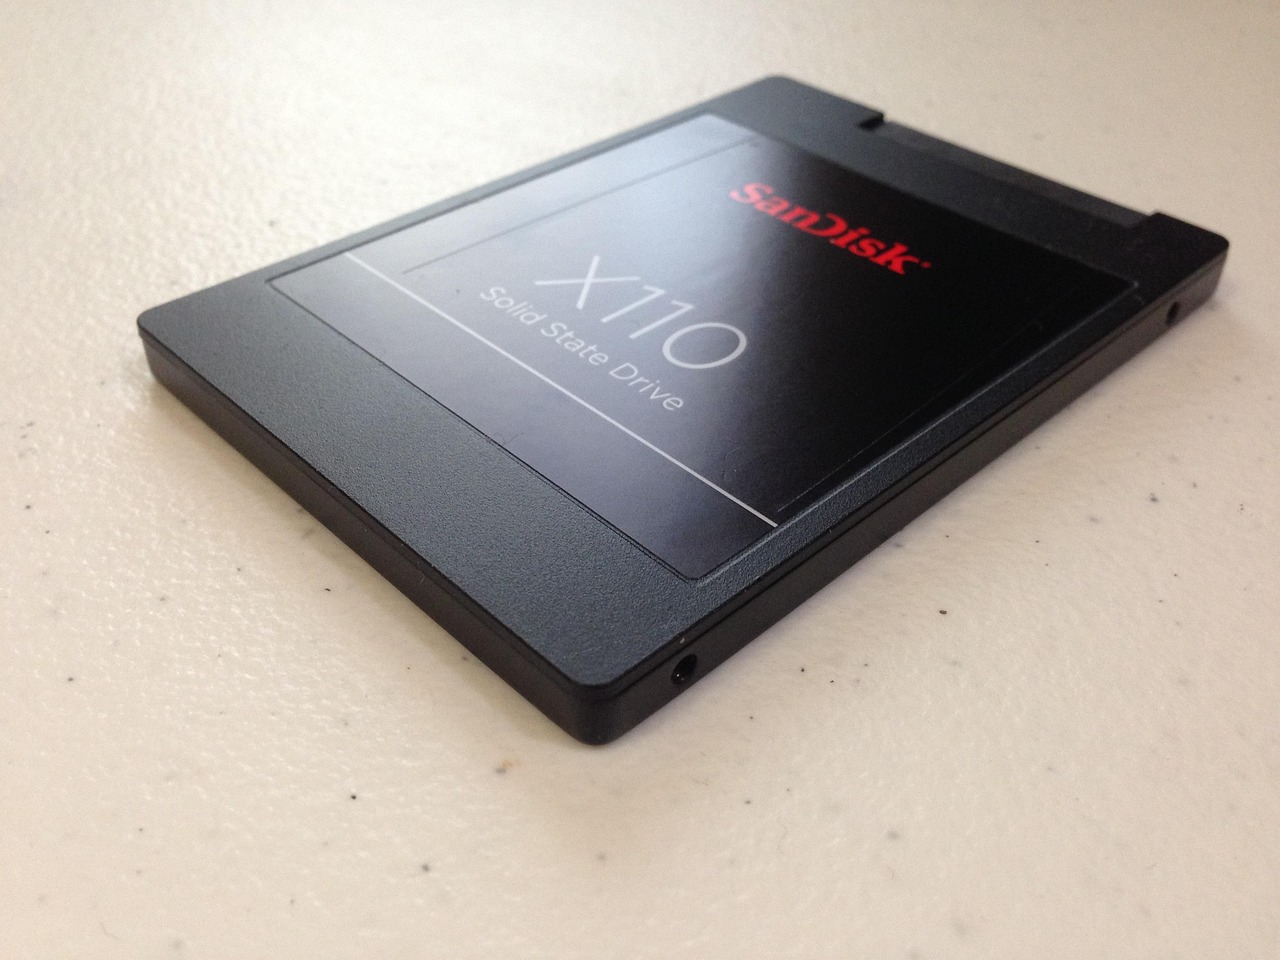
How could a money-losing company be a signal?
- SanDisk’s Bold Pivot From AI Boom Beneficiary to Bust Breaker
- S&P 500 Movers | Winners: SNDK, WDC, MU | Losers: DHR, MSCI, TYL
- S&P 500 Movers | Winners: ABT, JBHT, FDXF | Losers: SNDK, STX, GLW
- How Much SanDisk (SNDK) Are You Really Betting On?
- S&P 500 Movers | Winners: FDS, IT, INTU | Losers: APP, SNDK, MRVL
- SanDisk Stock’s Run Hides Its Real Portfolio Job
If you pulled up Sandisk’s numbers right before the run, you might have clicked away. As of its fiscal Q3 2025 report, released in May 2025, the company’s trailing-twelve-month net margin was -21%. It was losing a lot of money. But look closer. In that same report, revenue growth over the trailing twelve months had accelerated to 14.9%, a significant jump from its three-year average growth of just 3.6% a year.
This is the classic, coiled-spring setup in a cyclical industry like memory chips. Revenue turns first as prices begin to firm up, but the bottom line still looked weak. It’s the moment of maximum pessimism, but also the point where any sustained demand can send profits flying. This was the classic picture of a company whose stock was trading like the memory cycle is dead. The market saw the losses; a careful observer might have seen the leverage.
What was management doing about its new tech?
While the financials looked backward, management was looking forward. In that same report, the company noted the “strong early ramp of BiCS 8,” its newest memory technology. This represented a pivotal technological advance: the specific tech that would be perfectly positioned for the coming artificial intelligence demand wave. At the same time, the CEO had begun raising prices, a quiet confirmation that the cycle had indeed turned. They had the right product ramping up just as they were regaining pricing power.
Why was the options market so calm?
For all the tension building in the fundamentals, the options market seemed unimpressed. In the weeks leading up to the surge, implied volatility on Sandisk stock actually eased, falling from the 78th percentile of its one-year range down to the 65th percentile by early July 2025. Traders were pricing in a lower probability of a big move, not a higher one. The signal was so subtle that the very market designed to sniff out volatility was looking the other way.
The market saw a beaten-down cyclical stock turning a corner. What it missed was that this particular corner led directly onto a new highway.
Can You See A Run Like This Coming?
Some of it, yes. The single most visible pre-surge signal is a company guiding its own forecasts higher, and you do not have to hunt for those one call at a time. Our Guidance Momentum rankings list the names raising guidance with the price already moving with them. One signal is never the whole story, though. And if it is exposure to technology as a whole you want, rather than hunting the next single name to surge, a technology ETF like XLK covers that single sector. Going broader than any one sector, to a quality-first mix across the whole market, is the natural next step. The Trefis High Quality (HQ) Portfolio weighs the full range of quality signals across thousands of names, owns the 30 strongest, sizes and re-balances them with discipline, and has outpaced a benchmark that combines the three major indices – the S&P 500, S&P Mid-cap, and Russell 2000.