How To Trade SuperMicro Computer Stock Ahead Of Q4 Earnings?

Super Micro Computer (NASDAQ:SMCI) is set to report its Q4 2025 earnings around August 5, 2025 (June year). The stock has done exceedingly well in recent months ahead of Q4 earnings, rallying by close to 60% over the last three months. Per consensus estimates, revenues are likely to grow by about 11% year-over-year to $5.9 billion, while earnings are likely to come in at about $0.44 per share, down marginally compared to last year. Revenue growth will likely be driven by ongoing demand growth from the AI, cloud computing, and data center markets.
New products including high-memory X14 servers and advanced liquid-cooled GPU systems using AMD Instinct MI350s, which offer better performance and energy efficiency for dense AI workloads, are likely to be key drivers of the business over the quarter. We will be closely watching margins, which have been weak, as the company focuses on developing its liquid cooling technology for servers. As of Q3 FY’25, Super Micro’s gross margin, which is the percentage of revenue left after reducing the direct costs of producing goods, stood at just 9.6%, down from 11.8% in Q2 FY’25 and 15.5% in Q3 FY’24.
The company has $36 billion in current market capitalization. Revenue over the last twelve months was $22 billion, and it was operationally profitable with $1.3 billion in operating profits and net income of $1.2 billion. While a lot will depend on how results stack up against consensus and expectations, understanding historical patterns might just turn the odds in your favor if you are an event-driven trader.
There are two ways to do that: understand the historical odds and position yourself prior to the earnings release, or look at the correlation between immediate and medium-term returns post earnings and position yourself accordingly after the earnings are released. That said, if you seek upside with lower volatility than individual stocks, the Trefis High Quality portfolio presents an alternative – having outperformed the S&P 500 and generated returns exceeding 91% since its inception.
- Workday Stock: Strong Cash Flow Poised for a Re-Rating?
- Triggers That Could Ignite the Next Rally In NVIDIA Stock
- Philip Morris International Stock Hands $49 Bil Back – Worth a Look?
- Altria Stock Capital Return Hits $49 Bil
- FactSet Research Systems Stock Testing Price Floor – Buy Now?
- Arista Networks Stock Testing Price Floor – Buy Now?
See earnings reaction history of all stocks
Super Micro Computer’s Historical Odds Of Positive Post-Earnings Return
Some observations on one-day (1D) post-earnings returns:
- There are 20 earnings data points recorded over the last five years, with 10 positive and 10 negative one-day (1D) returns observed. In summary, positive 1D returns were seen about 50% of the time.
- However, this percentage decreases to 27% if we consider data for the last 3 years instead of 5.
- Median of the 10 positive returns = 12%, and median of the 10 negative returns = -11%
Additional data for observed 5-Day (5D), and 21-Day (21D) returns post earnings are summarized along with the statistics in the table below.
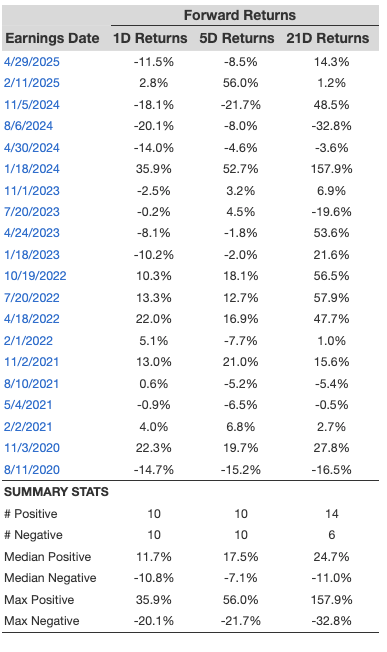
SMCI 1D, 5D, and 21D Post Earnings Return
Correlation Between 1D, 5D, and 21D Historical Returns
A relatively less risky strategy (though not useful if the correlation is low) is to understand the correlation between short-term and medium-term returns post earnings, find a pair that has the highest correlation, and execute the appropriate trade. For example, if 1D and 5D show the highest correlation, a trader can position themselves “long” for the next 5 days if 1D post-earnings return is positive. Here is some correlation data based on 5-year and 3-year (more recent) history. Note that the correlation 1D_5D refers to the correlation between 1D post-earnings returns and subsequent 5D returns.
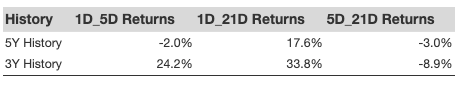
SMCI Correlation Between 1D, 5D and 21D Historical Returns
Is There Any Correlation With Peer Earnings?
Sometimes, peer performance can have influence on post-earnings stock reaction. In fact, the pricing-in might begin before the earnings are announced. Here is some historical data on the past post-earnings performance of Super Micro Computer stock compared with the stock performance of peers that reported earnings just before Super Micro Computer. For fair comparison, peer stock returns also represent post-earnings one-day (1D) returns.
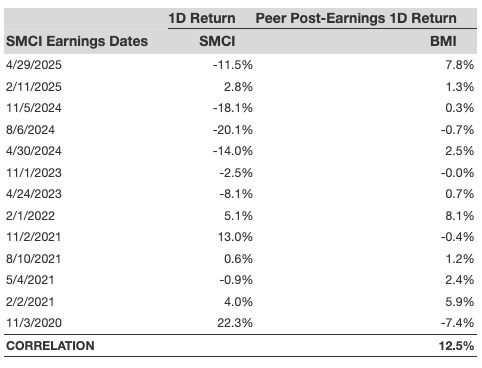
SMCI Correlation With Peer Earnings
Learn more about Trefis RV strategy that has outperformed its all-cap stocks benchmark (combination of all 3, the S&P 500, S&P mid-cap, and Russell 2000), to produce strong returns for investors. Separately, if you want upside with a smoother ride than an individual stock like Super Micro Computer, consider the High Quality portfolio, which has outperformed the S&P, and clocked >91% returns since inception.
Invest with Trefis Market-Beating Portfolios
See all Trefis Price Estimates