Will Earnings Results Move the Needle for Ross Stores?

Ross Stores (NASDAQ: ROST) is scheduled to release its fiscal first-quarter earnings on Thursday, May 22, 2025, with analysts projecting earnings of $1.43 per share on $4.96 billion in revenue. This would represent a 3% year-over-year decline in earnings and a 2% growth in sales compared to the prior year’s figures of $1.47 per share and $4.86 billion in revenue. Historically, ROST stock has increased 50% of the time following earnings announcements, with a median one-day rise of 3.6% and a maximum observed increase of 10%.
Ross Stores, a leader in off-price retail, capitalizes on excess inventory to offer major brand discounts. It recently grew its store count, targeting value-conscious shoppers while optimizing operations. Its “packaway” strategy enables timely inventory deployment, strengthening its pricing edge. For this fiscal year, Ross projects a flat to 3% decline in comparable store sales for the first quarter, citing cautious macroeconomic conditions. Management expects full-year EPS between $5.95 and $6.55, slightly down from $6.32 in the prior year, reflecting ongoing competitive pressures. With a market capitalization of $51 billion, Ross reported $21 billion in revenue over the past 12 months, generating $2.6 billion in operating profit and $2.1 billion in net income.
For event-driven traders, historical patterns may offer an edge, whether by positioning ahead of earnings or reacting to post-release moves. That said, if you seek upside with lower volatility than from individual stocks, the Trefis High Quality portfolio presents an alternative, having outperformed the S&P 500 and generated returns exceeding 91% since its inception. See earnings reaction history of all stocks.

Image by Michal Jarmoluk from Pixabay
- Get Paid 8.6% to Buy GOOGL at a 30% Discount – Here’s How
- What Could Spark the Next Big Move In Netflix Stock
- Why Amazon.com Stock May Drop Soon
- Cash Rich, Low Price – Gartner Stock to Break Out?
- Does Johnson & Johnson Stock Have More Upside?
- Has American Water Works Stock Quietly Become a Value Opportunity?
Ross Stores’ Historical Odds Of Positive Post-Earnings Return
Some observations on one-day (1D) post-earnings returns:
- There are 20 earnings data points recorded over the last five years, with 10 positive and 10 negative one-day (1D) returns observed. In summary, positive 1D returns were seen about 50% of the time.
- Notably, this percentage increases to 73% if we consider data for the last 3 years instead of 5.
- Median of the 10 positive returns = 3.6%, and median of the 10 negative returns = -1.9%
Additional data for observed 5-Day (5D), and 21-Day (21D) returns post earnings are summarized along with the statistics in the table below.

Correlation Between 1D, 5D, and 21D Historical Returns
A relatively less risky strategy (though not useful if the correlation is low) is to understand the correlation between short-term and medium-term returns post earnings, find a pair that has the highest correlation, and execute the appropriate trade. For example, if 1D and 5D show the highest correlation, a trader can position themselves “long” for the next 5 days if 1D post-earnings return is positive. Here is some correlation data based on 5-year and 3-year (more recent) history. Note that the correlation 1D_5D refers to the correlation between 1D post-earnings returns and subsequent 5D returns.
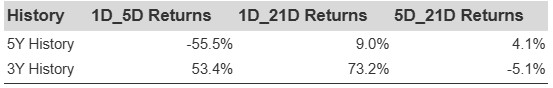
ROST Correlation Between 1D, 5D and 21D Historical Returns
Learn more about Trefis RV strategy that has outperformed its all-cap stocks benchmark (combination of all 3, the S&P 500, S&P mid-cap, and Russell 2000), to produce strong returns for investors.
Invest with Trefis Market-Beating Portfolios