How Will Roku Stock React To Its Upcoming Earnings?

Roku (NASDAQ:ROKU) is likely to report its Q2 2025 earnings in early August. We expect the company to post a net loss of about $0.16 per share, with revenue coming in at $1.07 billion, up about 11% compared to last year. Growth is likely to be driven by higher video advertising revenues and streaming services distribution activities. While the broader economy has faced headwinds amid tariff-related uncertainty with key trading partners, the streaming sector appears to be relatively resilient. Streaming bellwether Netflix recently delivered a better-than-expected set of Q2 2025 results, with 16% topline growth, indicating the demand for streaming entertainment was holding up well. That said, Roku could still face some challenges. The company has a sizable hardware segment and licensing deals with smart TV makers, some of whom are based in China. This could expose it to potential supply chain disruptions and cost pressures.
The company has $13 billion in current market capitalization. Revenue over the last twelve months was $4.3 billion, and it was operationally loss-making, with $-204 million in operating losses and net income of $-106 million. While a lot will depend on how results stack up against consensus and expectations, understanding historical patterns might just turn the odds in your favor if you are an event-driven trader. There are two ways to do that: understand the historical odds and position yourself prior to the earnings release, or look at the correlation between immediate and medium-term returns post earnings and position yourself accordingly after the earnings are released. That said, if you seek upside with lower volatility than individual stocks, the Trefis High Quality portfolio presents an alternative – having outperformed the S&P 500 and generated returns exceeding 91% since its inception.
See earnings reaction history of all stocks
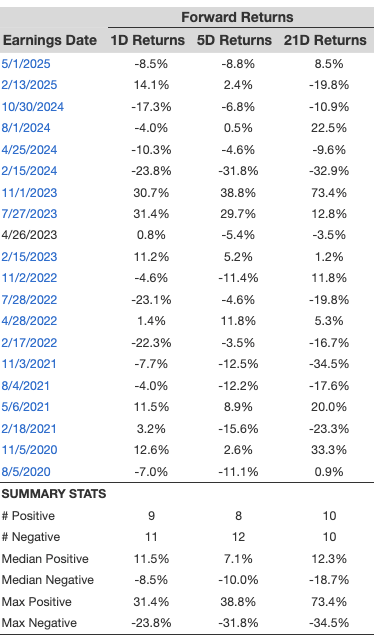
Roku’s Historical Odds Of Positive Post-Earnings Return
Some observations on one-day (1D) post-earnings returns:
- There are 20 earnings data points recorded over the last five years, with 9 positive and 11 negative one-day (1D) returns observed. In summary, positive 1D returns were seen about 45% of the time.
- However, this percentage decreases to 42% if we consider data for the last 3 years instead of 5.
- Median of the 9 positive returns = 12%, and median of the 11 negative returns = -8.5%
Additional data for observed 5-Day (5D), and 21-Day (21D) returns post earnings are summarized along with the statistics in the table below.
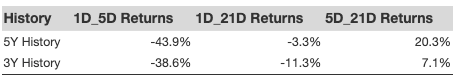
Correlation Between 1D, 5D, and 21D Historical Returns
A relatively less risky strategy (though not useful if the correlation is low) is to understand the correlation between short-term and medium-term returns post earnings, find a pair that has the highest correlation, and execute the appropriate trade. For example, if 1D and 5D show the highest correlation, a trader can position themselves “long” for the next 5 days if 1D post-earnings return is positive. Here is some correlation data based on 5-year and 3-year (more recent) history. Note that the correlation 1D_5D refers to the correlation between 1D post-earnings returns and subsequent 5D returns.
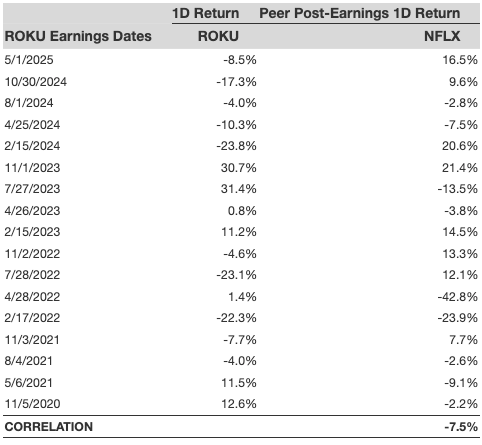
Is There Any Correlation With Peer Earnings?
Sometimes, peer performance can have influence on post-earnings stock reaction. In fact, the pricing-in might begin before the earnings are announced. Here is some historical data on the past post-earnings performance of Roku stock compared with the stock performance of peers that reported earnings just before Roku. For fair comparison, peer stock returns also represent post-earnings one-day (1D) returns.
Learn more about Trefis RV strategy that has outperformed its all-cap stocks benchmark (combination of all 3, the S&P 500, S&P mid-cap, and Russell 2000), to produce strong returns for investors. Separately, if you want upside with a smoother ride than an individual stock like Roku, consider the High Quality portfolio, which has outperformed the S&P, and clocked >91% returns since inception.
Invest with Trefis Market-Beating Portfolios
See all Trefis Price Estimates