How Will Ralph Lauren’s Stock React To Its Upcoming Earnings?

Note: Ralph Lauren’s FY’25 ended March 2025.
Ralph Lauren (NYSE: RL) is scheduled to release its fiscal fourth-quarter earnings on Thursday, May 22, 2025, with analysts projecting earnings of $2.40 per share on $1.65 billion in revenue. This would represent a 45% year-over-year increase in earnings and a 5% growth in sales compared to the prior year’s figures of $1.41 per share and $1.57 billion in revenue. Historically, RL stock has increased 63% of the time following earnings announcements, with a median one-day rise of 4.4% and a maximum observed increase of 17%.
The luxury apparel brand raised its full-year constant currency revenue growth forecast to 6–7% and anticipates an operating margin improvement of 120–160 basis points. The company plans to keep marketing expenses at approximately 7% of revenue and is aiming to launch its next-generation transformation initiative in fiscal 2027. For Q4 2025, Ralph Lauren projects 6–7% revenue growth in constant currency terms, along with an operating margin expansion of 120–140 basis points. The company currently has a market capitalization of $17 billion, with trailing 12-month revenue of $6.9 billion, operating income of $926 million, and net income of $705 million.
For event-driven traders, historical patterns may offer an edge, whether by positioning ahead of earnings or reacting to post-release moves. That said, if you seek upside with lower volatility than from individual stocks, the Trefis High Quality portfolio presents an alternative, having outperformed the S&P 500 and generated returns exceeding 91% since its inception. See earnings reaction history of all stocks.
- Better Value & Growth: RL, TPR Lead Nike Stock
- Ralph Lauren Stock: A Compounding Engine Facing Its North American Test
- Is Ralph Lauren Stock Optimizing Returns Through the Denominator Effect?
- Stronger Bet Than Nike Stock: TPR, RL Deliver More
- Better Value & Growth: TPR, RL Lead Nike Stock
- TPR, RL Top Nike Stock on Price & Potential

Ralph Lauren’s Historical Odds Of Positive Post-Earnings Return
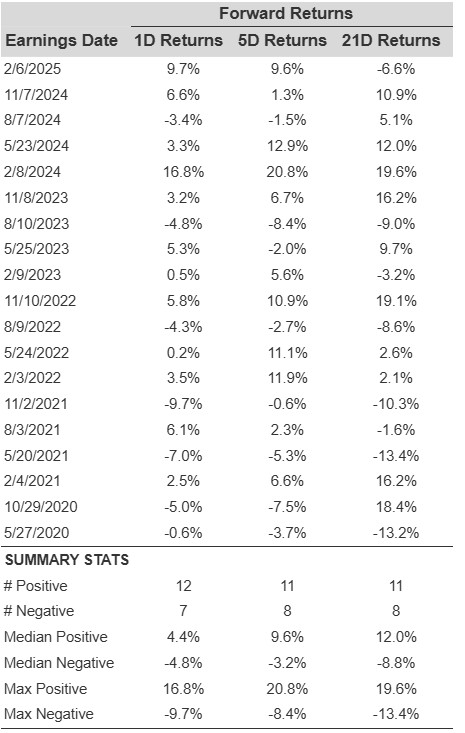
Some observations on one-day (1D) post-earnings returns:
- There are 19 earnings data points recorded over the last five years, with 12 positive and 7 negative one-day (1D) returns observed. In summary, positive 1D returns were seen about 63% of the time.
- Notably, this percentage increases to 75% if we consider data for the last 3 years instead of 5.
- Median of the 12 positive returns = 4.4%, and median of the 7 negative returns = -4.8%
Additional data for observed 5-Day (5D), and 21-Day (21D) returns post earnings are summarized along with the statistics in the table below
Correlation Between 1D, 5D, and 21D Historical Returns
A relatively less risky strategy (though not useful if the correlation is low) is to understand the correlation between short-term and medium-term returns post earnings, find a pair that has the highest correlation, and execute the appropriate trade. For example, if 1D and 5D show the highest correlation, a trader can position themselves “long” for the next 5 days if 1D post-earnings return is positive. Here is some correlation data based on 5-year and 3-year (more recent) history. Note that the correlation 1D_5D refers to the correlation between 1D post-earnings returns and subsequent 5D returns.
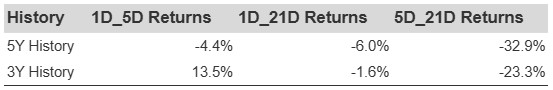
RL Correlation Between 1D, 5D and 21D Historical Returns
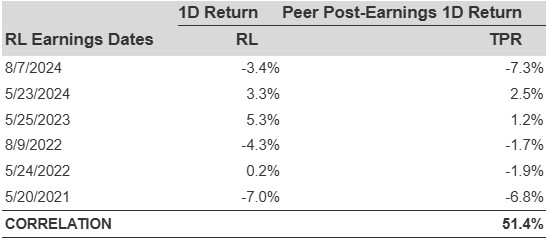
Is There Any Correlation With Peer Earnings?
Sometimes, peer performance can have influence on post-earnings stock reaction. In fact, the pricing-in might begin before the earnings are announced. Here is some historical data on the past post-earnings performance of Ralph Lauren stock compared with the stock performance of peers that reported earnings just before Ralph Lauren. For fair comparison, peer stock returns also represent post-earnings one-day (1D) returns.
Learn more about Trefis RV strategy that has outperformed its all-cap stocks benchmark (combination of all 3, the S&P 500, S&P mid-cap, and Russell 2000), to produce strong returns for investors.
Invest with Trefis Market-Beating Portfolios