How Sensitive Is Roche To Its Gross Profit Margin Change?

Roche Holdings’ (NASDAQ:RHHBY) gross profit will grow in mid-single digits in 2018, primarily led by the company’s pharmaceuticals business, which accounts for roughly 85% of its overall profits, according to our estimates. We have created an interactive dashboard on Roche’s sensitivity to changes in its gross profit margin. Note that you can adjust the margin drivers, and see the impact on Roche’s overall valuation and price estimate. Below are some of the charts and data from the interactive dashboard.
Expect Roche To Maintain Its Gross Profit Margins of 80% For Its Pharmaceuticals Business
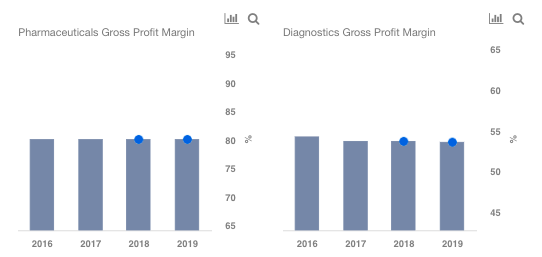
We forecast Roche’s gross profit margin separately for its Pharmaceuticals, and Diagnostics business. Pharmaceuticals gross profit margin, on average, has been around 80% over the last several years. We forecast the figure to stay around its current levels of 80% throughout the forecast period. We believe that Roche will be able to maintain its margins, as it has a bubbling phase 3 pipeline. New drug launches increase revenues and profits for firms due to lower competition in the early stages of market introduction. Roche expects to launch several new drugs in the coming years, with total peak sales of close to $25 billion, according to our estimates. In fact, Roche earlier this week announced the FDA approval for its Venclexta plus Rituxan for people with previously treated chronic lymphocytic leukemia. Venclexta’s peak sales are estimated to be north of $3 billion. While the new drugs will help Roche maintain its gross profit margins, it is unlikely to see any significant growth, primarily due to loss of exclusivity for several drugs in the coming years. Roche’s blockbuster drugs Rituxan, Herceptin, and Avastin will lose patent exclusivity between 2018-2020. Rituxan already faces biosimilar competition in Europe. It should be noted that these are top selling drugs for Roche, with sales of over $19 billion or 35% of the company’s overall revenues in 2017. This will put some pressure on margins and keep a check on the company’s overall growth. Looking at Roche’s Diagnostics business, we estimate the gross profit margin to be around 54% in the near term, similar to the levels seen over the past couple of years.
Despite unchanged margins, we expect the overall gross profit to grow in mid-single digits. This can be attributed to higher estimated revenues. We expect Roche’s Pharmaceuticals revenue to grow in mid-single digits in 2018, led by an expected ramp up in sales of its oncology drug Tecentriq and neuroscience drug Ocrevus. Both drugs have seen solid growth of late, and we expect this trend to continue in the near term.

Roche’s new molecular entities and significant line extensions will likely drive its future growth and partly offset revenue loss from upcoming patent expirations and generic competition, in our view. Currently, Roche has 74 new molecular entities in clinical development. This could result in better gross profit margins for the company in the coming years. Do you think that Roche’s gross profit margin could improve in the coming years? You can adjust the gross profit margins for each segment and arrive at your own estimates for the company. For instance, if Roche’s Pharmaceuticals segment margins grow to 84% by the end of 2019 owing to the success of its newer drugs, it would translate into an approximately 5% increase in the company’s valuation and stock price estimate (assuming other factors being constant), as in a scenario shown on our interactive dashboard.
What’s behind Trefis? See How It’s Powering New Collaboration and What-Ifs
For CFOs and Finance Teams | Product, R&D, and Marketing Teams
Like our charts? Explore example interactive dashboards and create your own.