Can PulteGroup Extend Its Post-Report Win Streak?

PulteGroup (NYSE: PHM), an American home construction company, is set to report its fiscal second-quarter earnings on Tuesday, July 22, 2025. Analysts predict the company will report earnings of $3.01 per share on $4.42 billion in sales. This would represent a 16% decline in adjusted earnings and a 4% fall in sales compared to the previous year’s figures of $3.58 per share and $4.60 billion, respectively. Historically, the stock has increased following earnings 70% of the time, with a median one-day rise of 4.4% and a maximum growth of 9%.
PulteGroup’s unit backlog declined 16% year-over-year in Q1, with backlog value down 12%, signaling potential pressure on future revenue. Navigating this softness amid rising competition and economic headwinds will be critical to sustaining growth in the quarters ahead. The company has $23 Bil in current market capitalization. Revenue over the last twelve months was $18 Bil, and it was operationally profitable with $3.8 Bil in operating profits and net income of $2.9 Bil. While a lot will depend on how results stack up against consensus and expectations, understanding historical patterns might turn the odds in your favor if you are an event-driven trader.
For event-driven traders, historical patterns may offer an edge, whether by positioning ahead of earnings or reacting to post-release moves. That said, if you seek upside with lower volatility than individual stocks, the Trefis High-Quality portfolio presents an alternative, having outperformed the S&P 500 and generated returns exceeding 91% since its inception. See earnings reaction history of all stocks.

Image by Paul Brennan from Pixabay
- This Strategy Pays You 8.7% While Lining Up MPWR at Bargain Prices
- What Could Light a Fire Under Microsoft Stock
- 3 Key Risks That Could Drag Down Meta Platforms Stock
- Cash Machine Trading Cheap – Fiserv Stock Set to Run?
- Is Recursion Pharmaceuticals Stock Attractive?
- Comfort Systems USA Stock’s Winning Streak May Not Be Over Yet
PulteGroup’s Historical Odds Of Positive Post-Earnings Return
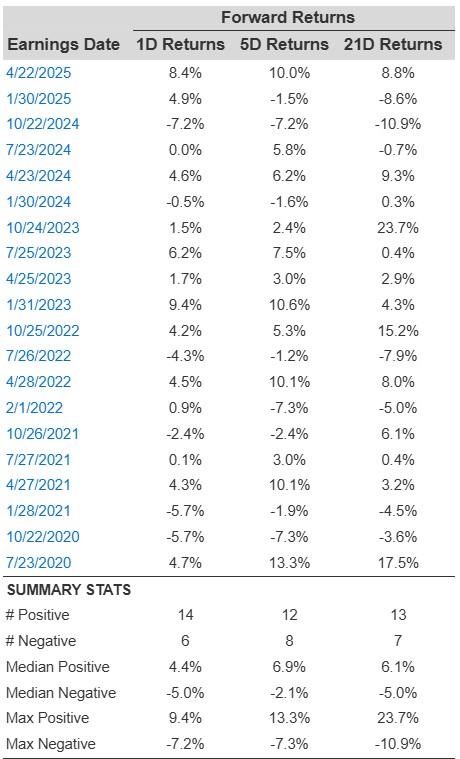
Some observations on one-day (1D) post-earnings returns:
- There are 20 earnings data points recorded over the last five years, with 14 positive and 6 negative one-day (1D) returns observed. In summary, positive 1D returns were seen about 70% of the time.
- Notably, this percentage increases to 75% if we consider data for the last 3 years instead of 5.
- Median of the 14 positive returns = 4.4%, and median of the 6 negative returns = -5.0%
Additional data for observed 5-Day (5D), and 21-Day (21D) returns post earnings are summarized along with the statistics in the table below.
Correlation Between 1D, 5D, and 21D Historical Returns
A relatively less risky strategy (though not useful if the correlation is low) is to understand the correlation between short-term and medium-term returns post earnings, find a pair that has the highest correlation, and execute the appropriate trade. For example, if 1D and 5D show the highest correlation, a trader can position themselves “long” for the next 5 days if 1D post-earnings return is positive. Here is some correlation data based on 5-year and 3-year (more recent) history. Note that the correlation 1D_5D refers to the correlation between 1D post-earnings returns and subsequent 5D returns.

Learn more about Trefis RV strategy that has outperformed its all-cap stocks benchmark (combination of all 3, the S&P 500, S&P mid-cap, and Russell 2000), to produce strong returns for investors.
Invest with Trefis Market-Beating Portfolios