
Is Par Pacific Stock Engineered To Make You Money?
For questions about this article or underlying research, email help@trefis.com.
Shares of Par Pacific (PARR) have returned 80.9% over the past twelve months, compared with 9.8% for the S&P 500. The stock has dropped 22.4% in the past month. Over three years, Par Pacific cut its diluted share count by 19.1%. Each remaining share now owns a larger slice of its profit, which may be part of what buyers are paying for. That profit swings sharply from quarter to quarter. So how much has the shrinking share count added to each share’s earnings?
How Much Has Par Pacific’s Buyback Added Per Share?
A good deal. Diluted earnings per share grew 30.5% a year over the three years to September 2026, compared with 21.8% a year for net income. That gap reflects net income being split among fewer shares.
The climb was not steady. Earnings per share fell to $4.75 in the twelve months to September 2025, from $8.58 two years earlier. The figure then jumped to $19.09 in the latest twelve months.
The buyback has also slowed. The share count fell 9.5% in the twelve months to September 2025, but only 2.4% in the latest twelve months. Net of the stock paid to employees, Par Pacific spent the equivalent of 1.7% of its market value on buybacks over the past year. Each share’s slice is still growing, just more slowly.
Par Pacific Earns Far More Cash Than Buybacks Cost
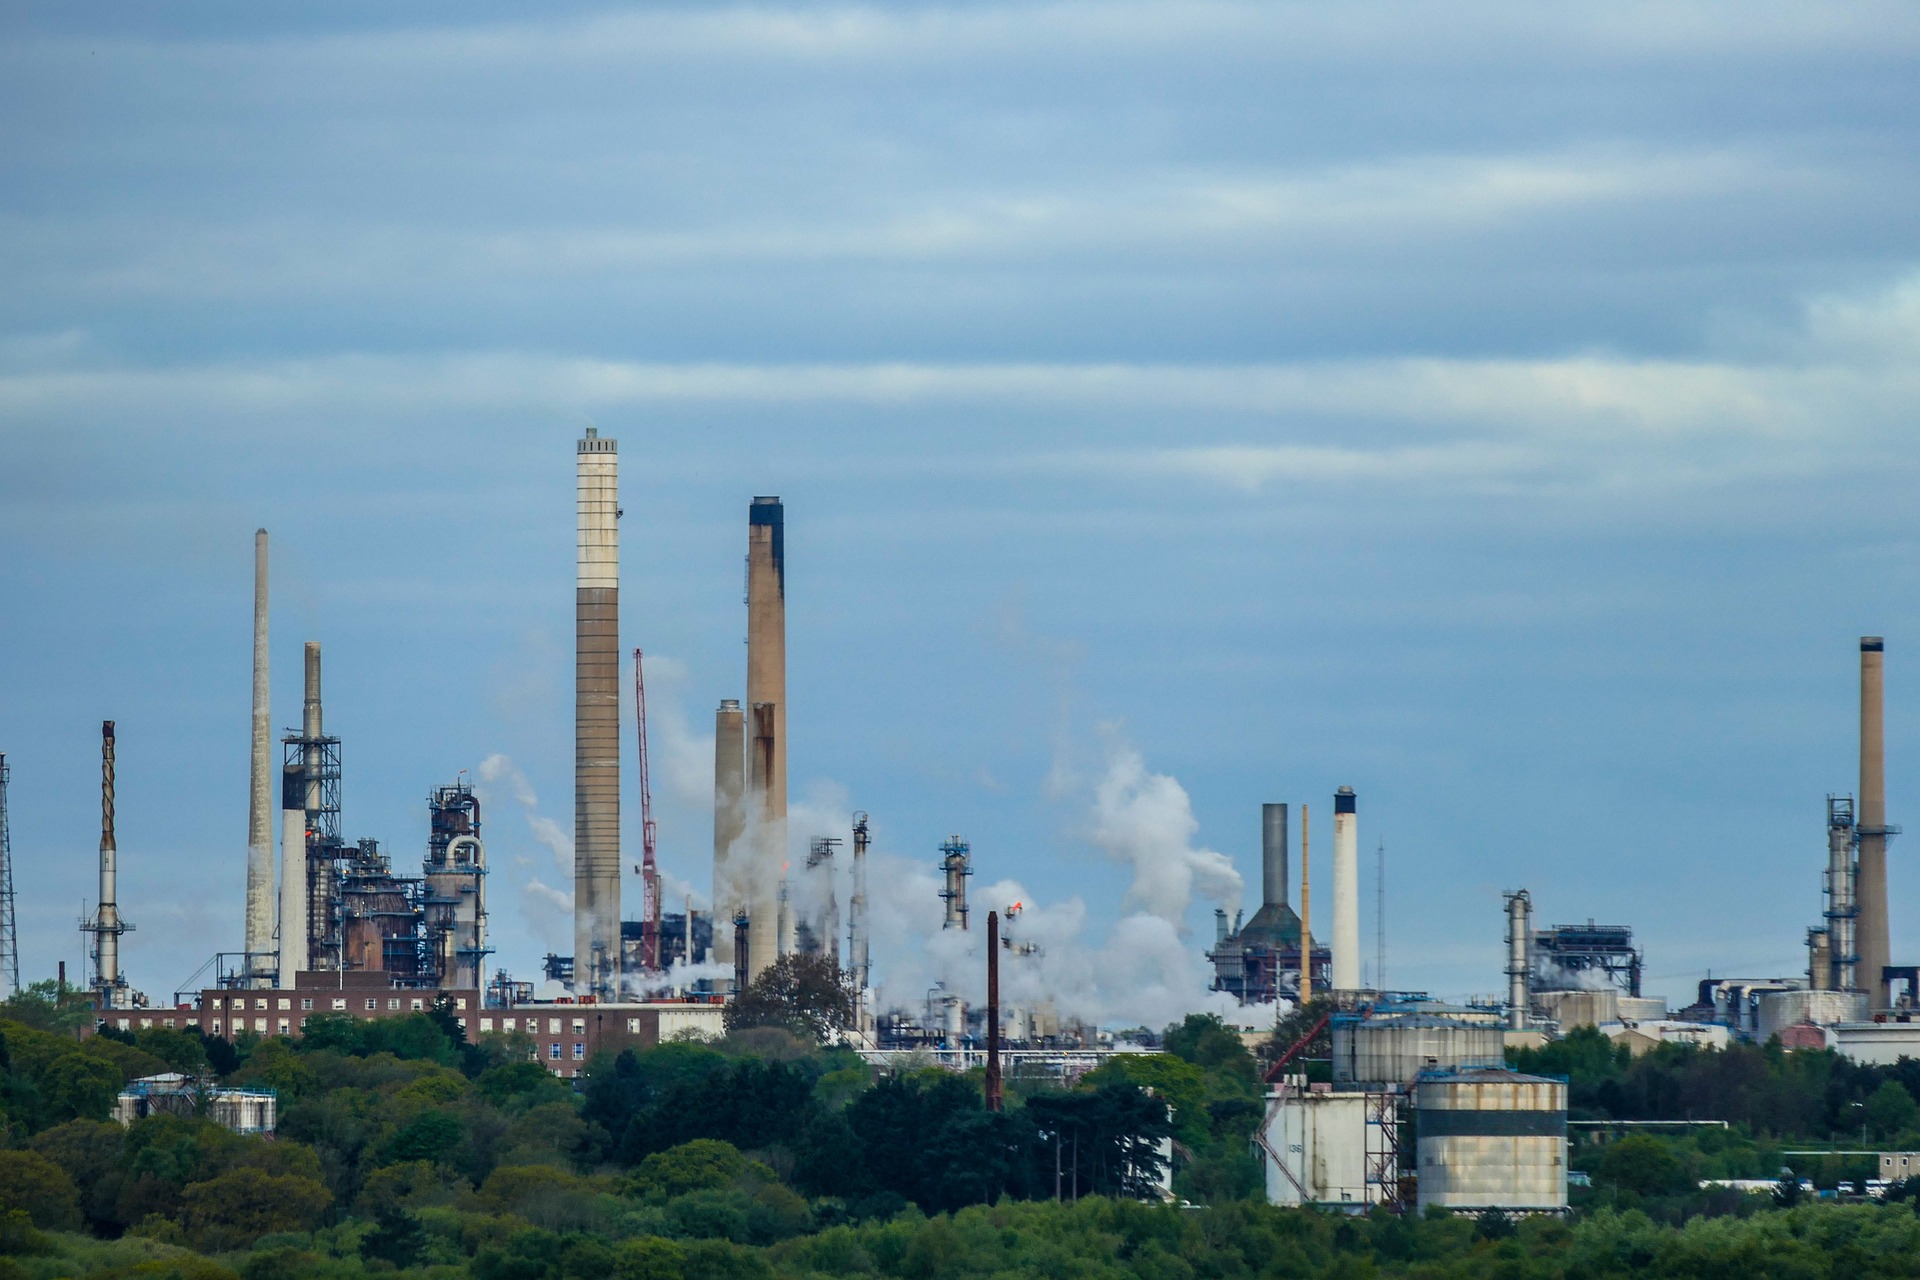
Par Pacific produced $1.03 billion of free cash flow in the latest twelve months. That is 13.7 times what the company spent on buybacks, and it pays no dividend. The business is almost all refining, operating plants in Hawaii, Washington, Wyoming and Montana. The company’s Refining segment brought in $7.21 billion of revenue in fiscal 2025, compared with $0.577 billion for Retail. Its operating margin was 13.0% over the latest twelve months, up from 5.0% a year earlier.
The cash did not arrive evenly. Free cash flow was $0.801 billion in the third quarter of 2026 alone, while the first quarter ended with negative free cash flow. Management said on the November 4, 2026 call that $387 million of that quarter’s operating cash came from working capital.
Debt is light next to that cash flow. Total debt was $0.867 billion at September 30, against $0.731 billion of cash. Operating income covered interest expense 23.1 times over the past year. In the third quarter, management repaid $243 million of borrowings but repurchased only $10 million of shares.
Light debt beside strong cash flow is an edge in a squeeze. In 2022, cash beat debt in every pair.
Was Par Pacific’s Latest Year A Normal One?
No, by management’s own account. On the November 4 call, executives called the recent period one of near-record margins. Par Pacific’s combined refining index, management’s gauge of fuel margins, averaged $38.45 per barrel in the third quarter, a quarterly record. That compares with an average of $12.40 in 2025.
Third-quarter results also included a $222 million gain related to 2025 small refinery exemptions. Management counted this gain in adjusted EBITDA, with $187 million of it in adjusted net income. The earnings per share figures above are reported, not that adjusted measure. Our data does not show how much of the gain, if any, sits in those reported figures. Par Pacific also expects to use up its federal tax losses in 2026 and become a regular federal cash taxpayer. The three-year rise in earnings per share ends on a year of near-record margins. If those margins fall back, the cash that pays for buybacks falls with them.
Today, refining cash covers the buyback with plenty to spare, while the share count is shrinking more slowly than it did. Par Pacific’s diluted share count and its spending on buybacks are the figures to watch when it reports its fourth quarter, expected in February 2027.
Does This Mean You Should Act On PARR?
Our purpose is to inform you with unique data so you make the right investment decisions. That said, betting on a single stock is always risky, no matter which direction you choose.
There is a smarter approach. Since its inception, the Trefis High Quality (HQ) Portfolio has returned 105%, beating the benchmark that combines the three major indices – the S&P 500, S&P Mid-cap, and Russell 2000. And it did so without taking the concentrated risk that comes with do-it-yourself stock picking. If that is how you want to invest, the HQ Portfolio is the place to start.
Spot an error or want more like this? Tell us in 10 seconds.