How Will Micron Technology Stock React To Its Upcoming Earnings?

Micron Technology (NASDAQ:MU) is expected to report its earnings on Tuesday, September 23, 2025. Earnings for the quarter are projected to come in at about $2.85 per share, up from $1.18 per share in the year-ago quarter, per consensus estimates. Revenues are likely to come in at about $11 billion, up 43% year-over-year. Growth is likely to be driven by demand for AI infrastructure, which is boosting sales of high-bandwidth memory products, also referred to as HBM. During Q3 FY’25, HBM revenue surged nearly 50% quarter-over-quarter, boosting the business to a $6 billion annualized run rate.
The company has $152 billion in current market capitalization. Revenue over the last twelve months was $34 billion, and it was operationally profitable, with $7.6 billion in operating profits and net income of $6.2 billion. While a lot will depend on how results stack up against consensus and expectations, understanding historical patterns might just turn the odds in your favor if you are an event-driven trader. related Micron Stock At 10x Earnings: AI’s Best Bargain?
There are two ways to do that: understand the historical odds and position yourself prior to the earnings release, or look at the correlation between immediate and medium-term returns post earnings and position yourself accordingly after the earnings are released. That said, if you seek upside with lower volatility than individual stocks, the Trefis High Quality portfolio presents an alternative – having outperformed the S&P 500 and generated returns exceeding 91% since its inception.
See earnings reaction history of all stocks
- Micron Stock’s Next Leg Higher Could Hinge On A New Kind of Deal
- Better Value & Growth: MU, NVDA Lead Broadcom Stock
- MU, NVDA Look Smarter Buy Than MACOM Technology Solutions Stock
- Should You Pay Attention To Micron Technology Stock’s Momentum?
- Should You Pay Attention To Micron Technology Stock’s Momentum?
- How Low Can MU Really Go In A Market Crash?
Micron Technology’s Historical Odds Of Positive Post-Earnings Return
Some observations on one-day (1D) post-earnings returns:
- There are 19 earnings data points recorded over the last five years, with 7 positive and 12 negative one-day (1D) returns observed. In summary, positive 1D returns were seen about 37% of the time.
- Notably, this percentage increases to 42% if we consider data for the last 3 years instead of 5.
- Median of the 7 positive returns = 8.6%, and median of the 12 negative returns = -4.2%
Additional data for observed 5-Day (5D) and 21-Day (21D) returns post earnings are summarized along with the statistics in the table below.
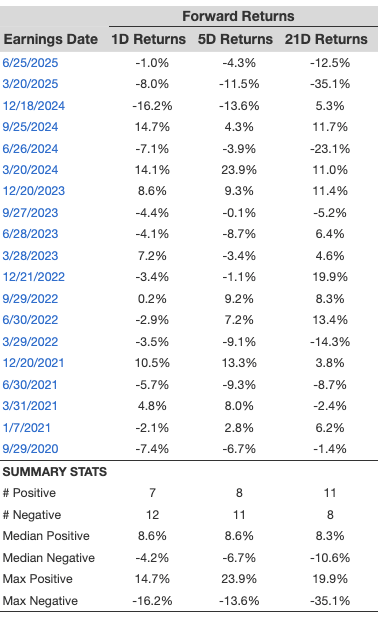
1D, 5D, and 21D Post Earnings Return
Correlation Between 1D, 5D, and 21D Historical Returns
A relatively less risky strategy (though not useful if the correlation is low) is to understand the correlation between short-term and medium-term returns post earnings, find a pair that has the highest correlation, and execute the appropriate trade. For example, if 1D and 5D show the highest correlation, a trader can position themselves “long” for the next 5 days if the 1D post-earnings return is positive. Here is some correlation data based on a 5-year and a 3-year (more recent) history. Note that the correlation 1D_5D refers to the correlation between 1D post-earnings returns and subsequent 5D returns.
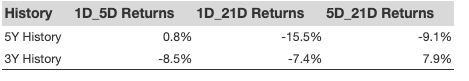
Correlation Between 1D, 5D and 21D Historical Returns
Learn more about Trefis RV strategy that has outperformed its all-cap stocks benchmark (combination of all 3, the S&P 500, S&P mid-cap, and Russell 2000), to produce strong returns for investors. Separately, if you want upside with a smoother ride than an individual stock like Micron Technology, consider the High Quality portfolio, which has outperformed the S&P and clocked >91% returns since inception.
Invest with Trefis Market-Beating Portfolios
See all Trefis Price Estimates