How Will Micron Technology Stock React To Its Upcoming Earnings?

Memory and storage solutions major Micron Technology (NASDAQ:MU) is set to report its earnings toward the end of June. Revenues are projected to grow by about 30% year-over-year to $8.83 billion, while earnings are projected to come in at $1.59 per share, up from $0.62 in the year-ago period. Micron has been seeing strong traction in its data center business as the AI boom continues unabated. Demand for high-bandwidth memory, used along with GPUs for AI applications, has been surging, with Micron seeing HBM memory revenue rise by about 50% sequentially over the last quarter as it ramps up production. Micron also appears to be better placed than its rivals, as the company says it has been gaining market share in these high-margin categories. Micron is also the only company currently mass-shipping low-power DRAM for data centers, which is becoming more crucial in the AI era as companies look to cut energy costs.
The company has $105 billion in current market capitalization. Revenue over the last twelve months was $31 billion, and it was operationally profitable with $6.2 billion in operating profits and net income of $4.7 billion. That said, if you seek upside with lower volatility than individual stocks, the Trefis High Quality portfolio presents an alternative, having outperformed the S&P 500 and generated returns exceeding 91% since its inception.
See earnings reaction history of all stocks
Micron Technology’s Historical Odds Of Positive Post-Earnings Return
- China Is Coming For Micron’s Thick Margins
- How Micron Used The AI Boom To Tame Its Oldest Demon
- Micron Stock Redefined Its Future, But the Market Isn’t Convinced Yet
- Micron Stock: Let’s Talk About Those Long-Term Contracts
- What Is The Price Of Micron Technology’s New Profitability Floor?
- S&P 500 Movers | Winners: SNDK, TECH, MU | Losers: AAPL, TJX, ROST
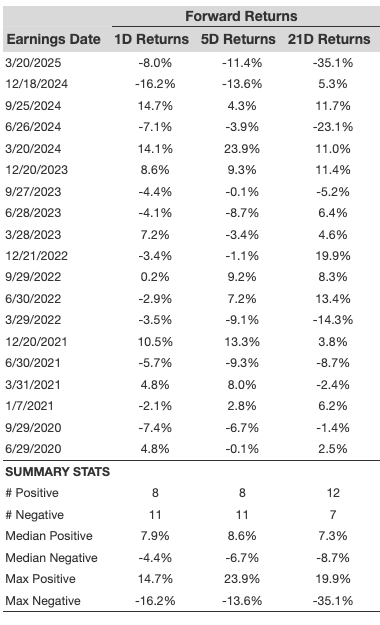
Some observations on one-day (1D) post-earnings returns:
- There are 19 earnings data points recorded over the last five years, with 8 positive and 11 negative one-day (1D) returns observed. In summary, positive 1D returns were seen about 42% of the time.
- However, this percentage remains constant at 42% if we consider data for the last 3 years instead of 5.
- Median of the 8 positive returns = 7.9%, and median of the 11 negative returns = -4.4%
Additional data for observed 5-Day (5D), and 21-Day (21D) returns post earnings are summarized along with the statistics in the table below.
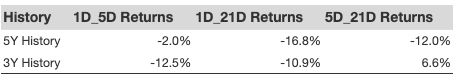
Correlation Between 1D, 5D, and 21D Historical Returns
A relatively less risky strategy (though not useful if the correlation is low) is to understand the correlation between short-term and medium-term returns post earnings, find a pair that has the highest correlation, and execute the appropriate trade. For example, if 1D and 5D show the highest correlation, a trader can position themselves “long” for the next 5 days if 1D post-earnings return is positive. Here is some correlation data based on a 5-year and a 3-year (more recent) history. Note that the correlation 1D_5D refers to the correlation between 1D post-earnings returns and subsequent 5D returns.
Learn more about Trefis RV strategy that has outperformed its all-cap stocks benchmark (combination of all 3, the S&P 500, S&P mid-cap, and Russell 2000), to produce strong returns for investors. Separately, if you want upside with a smoother ride than an individual stock like Micron Technology, consider the High Quality portfolio, which has outperformed the S&P and clocked >91% returns since inception.
Invest with Trefis Market-Beating Portfolios