How Will 3M Stock React To Its Upcoming Earnings?

3M (NYSE: MMM) is scheduled to announce its earnings on Tuesday, October 21, 2025. This report is a significant event for traders, particularly those who leverage event-driven strategies.
Over the last five years, 3M’s stock has demonstrated a balanced reaction to earnings announcements, with an equal split of positive and negative one-day returns following the results. In 50% of instances, the stock saw a positive one-day return, with a median of 4.8%. Conversely, in the other 50% of instances, it experienced a negative one-day return with a median of -2.8%. This historical pattern suggests a notable degree of volatility and a lack of consistent upward or downward bias post-earnings.
For the upcoming third quarter of 2025, consensus estimates anticipate earnings of $2.07 per share on sales of $6.26 billion. This compares with the year-ago quarter’s earnings per share of $2.14, although current sales are expected to be higher than the prior year’s $6.07 billion.
While the actual financial results and their comparison to consensus and expectations will heavily influence the stock’s immediate reaction, understanding these historical patterns can provide valuable insights for event-driven traders. There are two primary approaches to consider:
- Pre-Earnings Positioning: Based on the historical odds, a trader might choose to take a position before the earnings release, anticipating a move (either positive or negative) and managing the associated risk given the 50/50 split in past performance.
- Post-Earnings Positioning: Alternatively, a trader could wait for the earnings release, analyze the immediate market reaction and the correlation between short-term and medium-term returns, and then position themselves accordingly after the announcement.
From a fundamental perspective, 3M currently holds a market capitalization of approximately $81 billion. Over the last twelve months, the company generated $25 billion in revenue. It demonstrated operational profitability with $4.8 billion in operating profits and a net income of $3.9 billion.
That being said, if you seek an upside with less volatility than holding an individual stock, consider the High Quality Portfolio. It has comfortably outperformed its benchmark—a combination of the S&P 500, Russell, and S&P MidCap indexes—and has achieved returns exceeding 105% since its inception. Why is that? As a group, HQ Portfolio stocks provided better returns with less risk versus the benchmark index; less of a roller-coaster ride, as evident in HQ Portfolio performance metrics.
See earnings reaction history of all stocks

Image by WikimediaImages from Pixabay
3M’s Historical Odds Of Positive Post-Earnings Return
Some observations on one-day (1D) post-earnings returns:
- There are 20 earnings data points recorded over the last five years, with 10 positive and 10 negative one-day (1D) returns observed. In summary, positive 1D returns were seen about 50% of the time.
- Notably, this percentage increases to 58% if we consider data for the last 3 years instead of 5.
- Median of the 10 positive returns = 4.8%, and median of the 10 negative returns = -2.8%
Additional data for observed 5-Day (5D), and 21-Day (21D) returns post earnings are summarized along with the statistics in the table below.
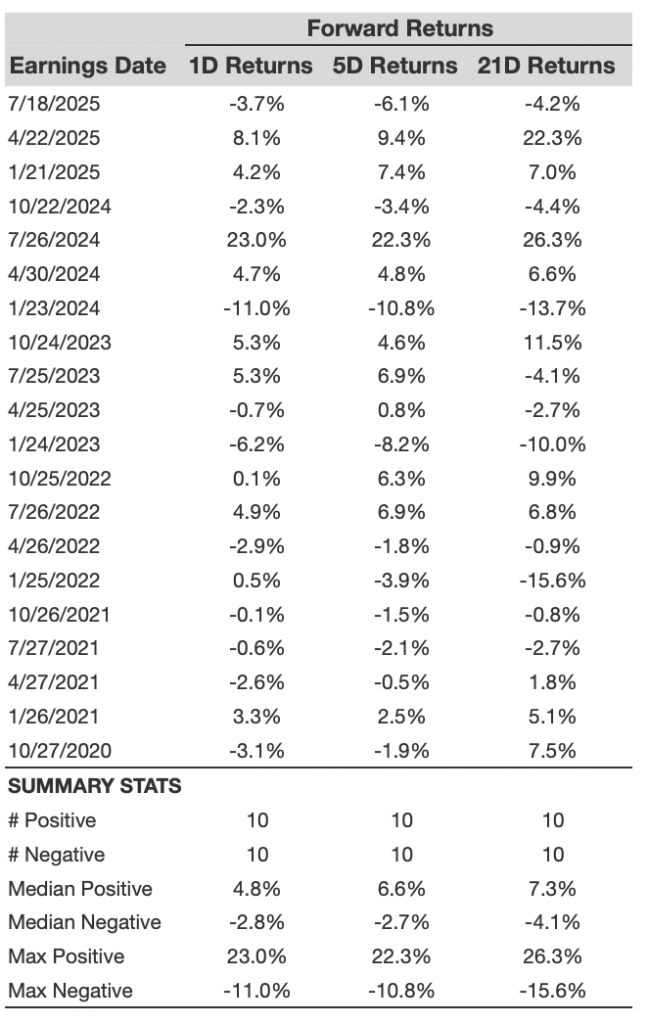
MMM 1D, 5D, and 21D Post Earnings Return
Correlation Between 1D, 5D, and 21D Historical Returns
A relatively less risky strategy (though not useful if the correlation is low) is to understand the correlation between short-term and medium-term returns post earnings, find a pair that has the highest correlation, and execute the appropriate trade. For example, if 1D and 5D show the highest correlation, a trader can position themselves “long” for the next 5 days if the 1D post-earnings return is positive. Here is some correlation data based on a 5-year and a 3-year (more recent) history. Note that the correlation 1D_5D refers to the correlation between 1D post-earnings returns and subsequent 5D returns.
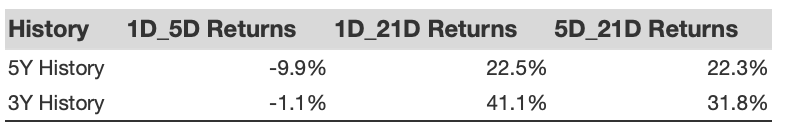
Correlation Between 1D, 5D, and 21D Historical Returns
Investing in a single stock without comprehensive analysis can be risky. Consider the Trefis Reinforced Value (RV) Portfolio, which has outperformed its all-cap stocks benchmark (combination of the S&P 500, S&P mid-cap, and Russell 2000 benchmark indices) to produce strong returns for investors. Why is that? The quarterly rebalanced mix of large-, mid-, and small-cap RV Portfolio stocks provided a responsive way to make the most of upbeat market conditions while limiting losses when markets head south, as detailed in RV Portfolio performance metrics.
Invest with Trefis Market-Beating Portfolios
See all Trefis Price Estimates