How Will McDonald’s Stock React To Its Upcoming Earnings?

McDonald’s (NYSE: MCD) is scheduled to release its fiscal second-quarter earnings on Wednesday, August 6, 2025, with analysts projecting adjusted earnings of $3.14 per share on $6.7 billion in revenue. This would represent a 6% year-over-year increase in earnings and a 3% rise in sales compared to the prior year’s figures of $2.97 per share and $6.5 billion in revenue. Historically, MCD stock has shown a tendency to underperform following earnings announcements, having declined 53% of the time with a median one-day drop of 0.6% and a maximum observed decline of 4%.
McDonald’s kicked off 2025 with a challenging quarter, driven by macroeconomic headwinds and soft U.S. traffic. Offsets from value pricing, menu innovation (notably Minecraft tie‑in and McCrispy), and FX tailwinds are expected to fuel a turnaround through the rest of the year. The company reaffirmed its full‑year targets and expects a gradual recovery in Q2 and beyond. The company has $217 Bil in current market capitalization. Revenue over the last twelve months was $26 Bil, and it was operationally profitable with $12 Bil in operating profits and net income of $8.2 Bil. While a lot will depend on how results stack up against consensus and expectations, understanding historical patterns might turn the odds in your favor if you are an event-driven trader.
For event-driven traders, historical patterns may offer an edge, whether by positioning ahead of earnings or reacting to post-release moves. That said, if you seek upside with lower volatility than from individual stocks, the Trefis High Quality portfolio presents an alternative, having outperformed the S&P 500 and generated returns exceeding 91% since its inception.
See earnings reaction history of all stocks.
- DRI, YUMC Top McDonald’s Stock on Price & Potential
- Better Value & Growth: DRI, YUMC Lead McDonald’s Stock
- Stronger Bet Than McDonald’s Stock: DRI, YUMC Deliver More
- McDonald’s Stock Pays Out $79 Bil – Investors Take Note
- Better Value & Growth: DRI, YUMC Lead McDonald’s Stock
- Stronger Bet Than McDonald’s Stock: DRI, YUMC Deliver More

Image by andreas160578 from Pixabay
Historical Odds Of Positive Post-Earnings Return
Some observations on one-day (1D) post-earnings returns:
- There are 19 earnings data points recorded over the last five years, with 9 positive and 10 negative one-day (1D) returns observed. In summary, positive 1D returns were seen about 47% of the time.
- However, this percentage decreases to 45% if we consider data for the last 3 years instead of 5.
- Median of the 9 positive returns = 2.7%, and median of the 10 negative returns = -0.6%
Additional data for observed 5-Day (5D) and 21-Day (21D) returns post earnings are summarized along with the statistics in the table below.
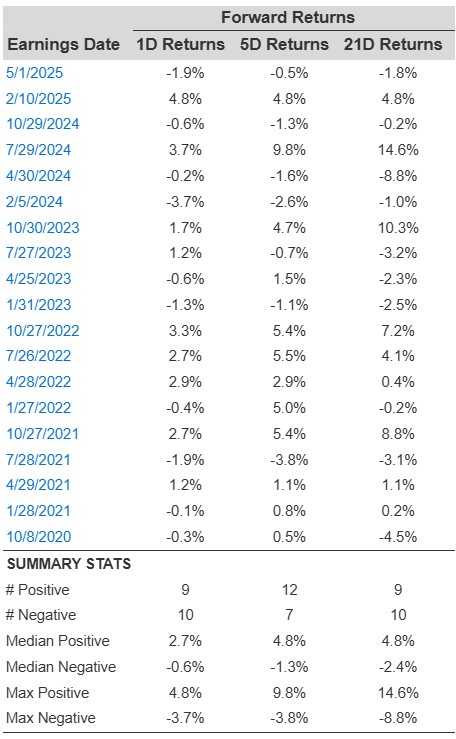
MCD Forward Returns 1D, 5D, 21D Returns
Correlation Between 1D, 5D, and 21D Historical Returns
A relatively less risky strategy (though not useful if the correlation is low) is to understand the correlation between short-term and medium-term returns post earnings, find a pair that has the highest correlation, and execute the appropriate trade. For example, if 1D and 5D show the highest correlation, a trader can position themselves “long” for the next 5 days if the 1D post-earnings return is positive. Here is some correlation data based on a 5-year and a 3-year (more recent) history. Note that the correlation 1D_5D refers to the correlation between 1D post-earnings returns and subsequent 5D returns.
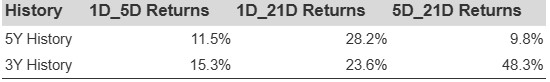
MCD Correlation Between 1D, 5D and 21D Historical Returns
Is There Any Correlation With Peer Earnings?
Sometimes, peer performance can have an influence on post-earnings stock reaction. In fact, the pricing-in might begin before the earnings are announced. Here is some historical data on the past post-earnings performance of McDonald’s stock compared with the stock performance of peers that reported earnings just before McDonald’s. For fair comparison, peer stock returns also represent post-earnings one-day (1D) returns.
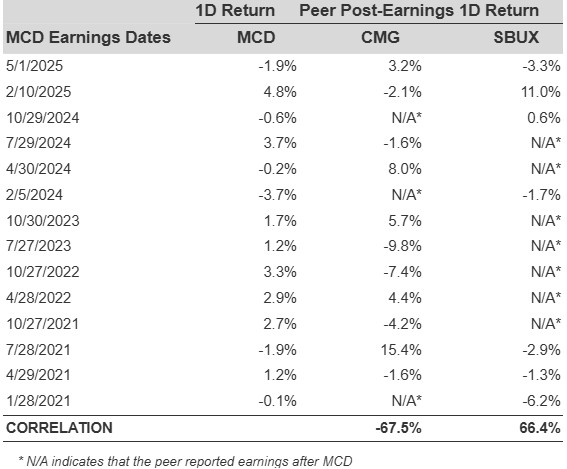
MCD Correlation With Peer Earnings
Learn more about Trefis RV strategy that has outperformed its all-cap stocks benchmark (combination of all 3, the S&P 500, S&P mid-cap, and Russell 2000), to produce strong returns for investors.
Invest with Trefis Market-Beating Portfolios
See all Trefis Price Estimates