
Can Macy’s Stock Rebound After An 8% Fall In The Last Ten Days?
Macy’s stock (NYSE: M), a department store chain, declined by 8% in the last ten trading days (two weeks). In comparison, the broader S&P500 index grew almost 3% over the same period. The company saw its net sales rise 40% year-over-year (y-o-y) to $25.3 billion. It should be noted that the company’s sales were flat compared to the pre-pandemic year, but adjusted diluted EPS grew 82% to $5.31 versus 2019. Macy’s has experienced a stunning improvement during 2021 as compared to the early months of the Covid-19 pandemic in 2020, and it continues to expect strong growth in the fiscal first quarter of 2022 as well. However, the department store giant could face much tougher comparisons in the second quarter and beyond. To add to this, the company faces cost pressures, particularly from its decision to increase its minimum wage to $15 an hour. On a full-year basis, Macy’s expects sales to grow 0% to 1% and is calling for adjusted EPS to moderate to a range of $4.13 to $4.52 in 2022. This implies a double-digit EPS decline compared to the record high of $5.31 reached in 2021.
Macy’s has lined up many growth initiatives, including new store-within-store partnerships with Toys R Us, a third-party marketplace on its e-commerce site, and the expansion of its small-format store fleet. The company announced that it will continue expanding its own off-price concept Backstage at a rapid pace in 2022. These Backstage stores are designed on the concept of offering on-trend affordable fashion deals to customers, located inside the Macy’s select stores generally ranging from 11-16K square feet of retail space.
Now, is M stock poised to decline in the short term or are gains looking more likely? Based on our machine learning analysis of trends in the stock price over the last ten years, there is a 51% chance of a rise in M stock over the next month (twenty-one trading days). See our analysis on Macy’s Stock Chance Of Rise for more details.
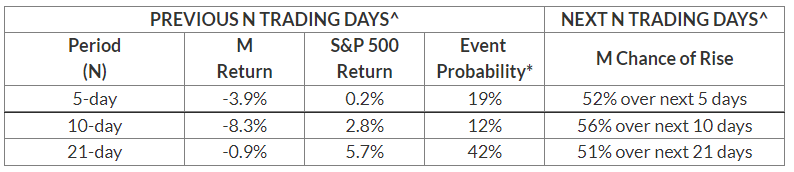
Calculation of ‘Event Probability’ and ‘Chance of rising’ using last ten years’ data
[1] Returns of -3.9% or lower over a five-day period on 470 occasions out of 2516 (19%); Stock rose in the next five days in 246 of these 470 instances (52%)
[2] Returns of -8.3% or lower over a ten-day period on 306 occasions out of 2516 (12%); Stock rose in the next ten days in 170 of these 306 instances (56%)
[3] Returns of -0.9% or lower over a twenty-one-day period on 1057 occasions out of 2516 (42%); Stock rose in the next twenty-one days in 541 of these 1057 instances (51%)
It is helpful to see how its peers stack up. M Peers shows how Macy’s stock compares against peers on metrics that matter. You will find other useful comparisons for companies across industries at Peer Comparisons.
What if you’re looking for a more balanced portfolio instead? Here’s a high-quality portfolio that’s beaten the market consistently since the end of 2016.
| Returns | Apr 2022 MTD [1] |
2022 YTD [1] |
2017-22 Total [2] |
| M Return | 1% | -6% | -31% |
| S&P 500 Return | 1% | -4% | 105% |
| Trefis MS Portfolio Return | 2% | -5% | 272% |
[1] Month-to-date and year-to-date as of 4/5/2022
[2] Cumulative total returns since the end of 2016
Invest with Trefis Market Beating Portfolios