How To Trade Lam Research Stock Ahead of Its Upcoming Earnings?

Lam Research (NASDAQ: LRCX), a leading supplier of chip fabrication equipment, is scheduled to report its earnings on Wednesday, October 22, 2025.
Financial Snapshot
The company currently holds an impressive market capitalization of $180 billion. Over the last twelve months, Lam Research was operationally profitable, reporting $18 billion in revenue, $5.9 billion in operating profit, and $5.4 billion in net income.
Current consensus forecasts earnings of $1.22 per share on sales of $5.23 billion. This compares to year-ago figures of $1.28 per share and $4.17 billion in sales.
Historical Earnings Volatility
Lam Research’s stock presents an interesting case for event-driven traders, as its post-earnings movement lacks a strong historical bias.
- How To Earn 9.2% Yield While Waiting to Buy LLY 30% Cheaper
- Could Accenture Stock’s Cash Flow Spark the Next Rally?
- Years of Rewards: $35 Bil From Charter Communications Stock
- McDonald’s Stock Capital Return Hits $35 Bil
- Palo Alto Networks Stock at Support Zone – Bargain or Trap?
- Super Micro Computer Stock Pulls Back to Support – Smart Entry?
Over the last five years, the stock has shown an equal chance of rising or falling after the results announcement:
- Positive One-Day Return (50% of instances): Median gain of 5.7%.
- Negative One-Day Return (50% of instances): Median loss of -3.3%.
This balanced volatility suggests LRCX is not a typical stock to trade based on a predictable earnings surprise, but rather aligns with its profile as a strong buy-and-hold stock. For context, LRCX has seen extremely strong long-term gains, rising 210% (from $45 in early January 2021 to around $140 now), significantly outpacing the S&P 500’s increase of about 75% over the same roughly five-year period.
Strategy for Event-Driven Traders
While a lot depends on how the results stack up against consensus, historical patterns can still offer an edge. Traders can:
- Position Pre-Release: Understand the historical odds (i.e., the size of the median move) and position themselves before the earnings release.
- Position Post-Release: Examine the correlation between the immediate one-day return and medium-term returns to position themselves after the earnings are released.
That being said, if you seek an upside with less volatility than holding an individual stock, consider the High Quality Portfolio. It has comfortably outperformed its benchmark—a combination of the S&P 500, Russell, and S&P MidCap indexes—and has achieved returns exceeding 105% since its inception. Why is that? As a group, HQ Portfolio stocks provided better returns with less risk versus the benchmark index; less of a roller-coaster ride, as evident in HQ Portfolio performance metrics.
Image by Dmitrii Bardadim from Pixabay
See the earnings reaction history of all stocks
Lam Research’s Historical Odds Of Positive Post-Earnings Return
Some observations on one-day (1D) post-earnings returns:
- There are 20 earnings data points recorded over the last five years, with 10 positive and 10 negative one-day (1D) returns observed. In summary, positive 1D returns were seen about 50% of the time.
- Notably, this percentage increases to 73% if we consider data for the last 3 years instead of 5.
- Median of the 10 positive returns = 5.7%, and median of the 10 negative returns = -3.3%
Additional data for observed 5-Day (5D) and 21-Day (21D) returns post earnings are summarized along with the statistics in the table below.
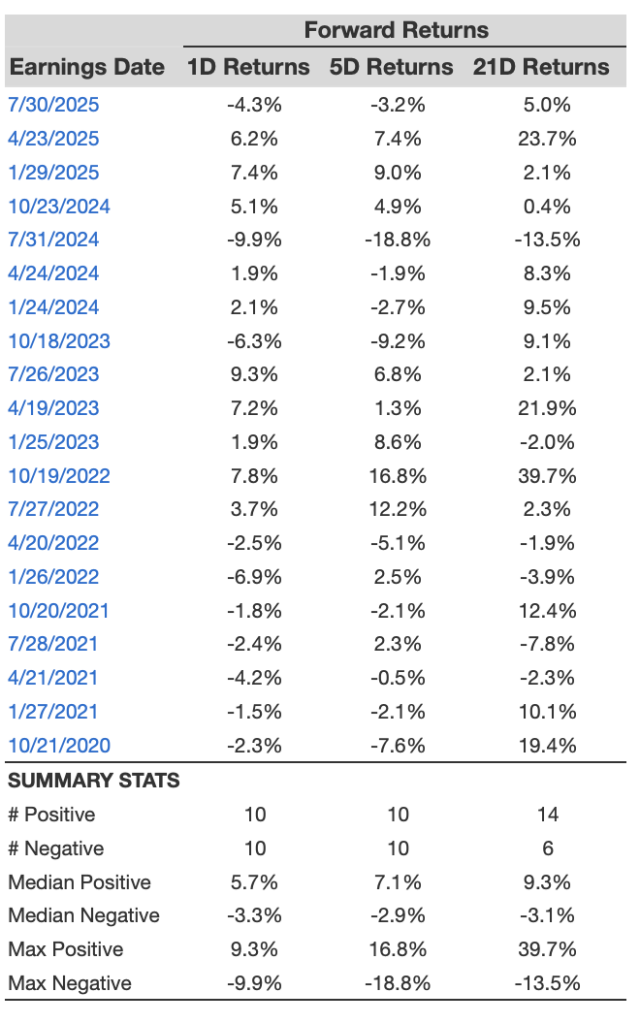
LRCX 1D, 5D, and 21D Post Earnings Return
Correlation Between 1D, 5D, and 21D Historical Returns
A relatively less risky strategy (though not useful if the correlation is low) is to understand the correlation between short-term and medium-term returns post earnings, find a pair that has the highest correlation, and execute the appropriate trade. For example, if 1D and 5D show the highest correlation, a trader can position themselves “long” for the next 5 days if the 1D post-earnings return is positive. Here is some correlation data based on a 5-year and a 3-year (more recent) history. Note that the correlation 1D_5D refers to the correlation between 1D post-earnings returns and subsequent 5D returns.
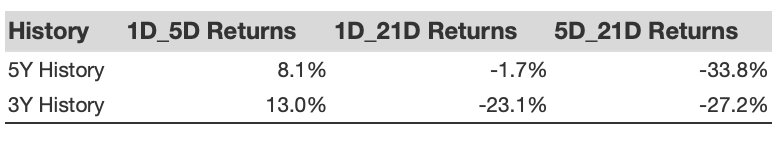
LRCX Correlation Between 1D, 5D and 21D Historical Returns
Investing in a single stock without comprehensive analysis can be risky. Consider the Trefis Reinforced Value (RV) Portfolio, which has outperformed its all-cap stocks benchmark (combination of the S&P 500, S&P mid-cap, and Russell 2000 benchmark indices) to produce strong returns for investors. Why is that? The quarterly rebalanced mix of large-, mid-, and small-cap RV Portfolio stocks provided a responsive way to make the most of upbeat market conditions while limiting losses when markets head south, as detailed in RV Portfolio performance metrics.
Invest with Trefis Market-Beating Portfolios
See all Trefis Price Estimates