How Will Lennar Stock React To Its Upcoming Earnings?

Lennar (NYSE:LEN) is set to report earnings on Thursday, September 18, 2025, with consensus pointing to about $2.10 per share in earnings and $9.05 billion in revenue. That would mark a roughly 4% year-over-year revenue decline, on account of elevated mortgage rates, affordability challenges, and somewhat soft consumer confidence. This has been forcing Lennar to lean more heavily on sales incentives to sustain momentum. While incentives have helped somewhat to hold up unit sales, they have also compressed margins, limiting earnings upside. Moreover, Lennar’s exposure to first-time and entry-level buyers make it particularly vulnerable to the affordability crunch, since these customers are the most sensitive to borrowing costs.
The company has $36 billion in current market capitalization. Revenue over the last twelve months was $35 billion, and it was operationally profitable with $4.1 billion in operating profits and net income of $3.3 billion. While a lot will depend on how results stack up against consensus and expectations, understanding historical patterns might just turn the odds in your favor if you are an event-driven trader.
There are two ways to do that: understand the historical odds and position yourself prior to the earnings release, or look at the correlation between immediate and medium-term returns post earnings and position yourself accordingly after the earnings are released. That said, if you seek upside with lower volatility than individual stocks, the Trefis High Quality portfolio presents an alternative – having outperformed the S&P 500 and generated returns exceeding 91% since its inception.
See earnings reaction history of all stocks
- Cleveland-Cliffs Stock: Can 2026 Mark a Turnaround Year?
- Why Is Nvidia’s 6 Year Old GPU Still Sold Out?
- How To Earn 8.2% Yield While Waiting to Buy SBUX 30% Cheaper
- 3 Forces That Could Shake Broadcom Stock
- Could Accenture Stock’s Cash Flow Spark the Next Rally?
- Should You Pay Attention To GE Aerospace Stock’s Momentum?
Lennar’s Historical Odds Of Positive Post-Earnings Return
Some observations on one-day (1D) post-earnings returns:
- There are 20 earnings data points recorded over the last five years, with 8 positive and 12 negative one-day (1D) returns observed. In summary, positive 1D returns were seen about 40% of the time.
- However, this percentage decreases to 25% if we consider data for the last 3 years instead of 5.
- Median of the 8 positive returns = 3.7%, and median of the 12 negative returns = -4.0%
Additional data for observed 5-Day (5D) and 21-Day (21D) returns post earnings are summarized along with the statistics in the table below.
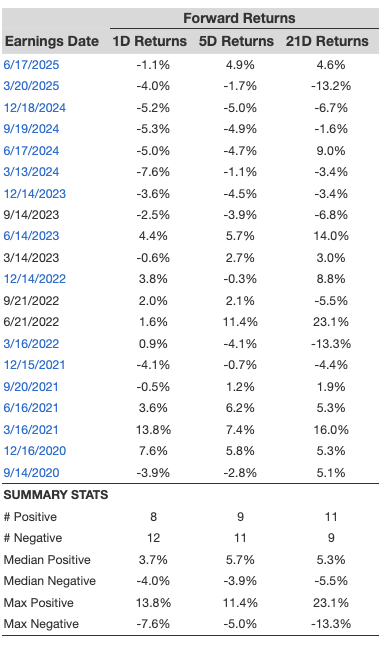
1D, 5D, and 21D Post Earnings Return
Correlation Between 1D, 5D, and 21D Historical Returns
A relatively less risky strategy (though not useful if the correlation is low) is to understand the correlation between short-term and medium-term returns post earnings, find a pair that has the highest correlation, and execute the appropriate trade. For example, if 1D and 5D show the highest correlation, a trader can position themselves “long” for the next 5 days if the 1D post-earnings return is positive. Here is some correlation data based on a 5-year and a 3-year (more recent) history. Note that the correlation 1D_5D refers to the correlation between 1D post-earnings returns and subsequent 5D returns.
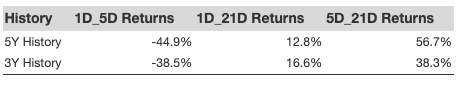
Correlation Between 1D, 5D and 21D Historical Returns
Is There Any Correlation With Peer Earnings?
Sometimes, peer performance can have an influence on post-earnings stock reaction. In fact, the pricing-in might begin before the earnings are announced. Here is some historical data on the past post-earnings performance of Lennar stock compared with the stock performance of peers that reported earnings just before Lennar. For fair comparison, peer stock returns also represent post-earnings one-day (1D) returns.

Correlation With Peer Earnings
Learn more about Trefis RV strategy that has outperformed its all-cap stocks benchmark (combination of all 3, the S&P 500, S&P mid-cap, and Russell 2000), to produce strong returns for investors. Separately, if you want upside with a smoother ride than an individual stock like Lennar, consider the High Quality portfolio, which has outperformed the S&P and clocked >91% returns since inception.
Invest with Trefis Market-Beating Portfolios
See all Trefis Price Estimates