How Will IBM Stock React To Its Upcoming Earnings?

IBM (NYSE:IBM) is scheduled to release its earnings report on Wednesday, July 23, 2025. Over the past five years, IBM has demonstrated a tendency for positive one-day returns in 63% of instances following its earnings announcements. The median positive return on these occasions was a significant 4.8%, with a maximum one-day positive return reaching 13.0%.
For event-driven traders, while actual results relative to consensus and expectations will be crucial, an understanding of these historical patterns can potentially provide an edge. Traders have two primary strategies when approaching IBM’s earnings:
- Pre-Earnings Positioning: Based on the historical probabilities, one could choose to establish a position before the earnings report is released.
- Post-Earnings Positioning: Alternatively, after the earnings release, traders can analyze the correlation between immediate and medium-term returns to guide their positioning.
Current consensus estimates for IBM’s upcoming earnings are $2.66 per share on revenue of $16.58 billion. This is an increase compared to the year-ago quarter, which reported earnings of $2.43 per share on revenue of $15.77 billion.
From a fundamental perspective, IBM currently boasts a market capitalization of $265 billion. Over the last twelve months, the company generated revenues of $63 billion, achieved $10 billion in operating profits, and reported a net income of $5.5 billion.
- Buy or Sell International Business Machines Stock?
- Is International Business Machines Stock Built to Withstand More Downside?
- Would You Still Hold International Business Machines Stock If It Fell Another 30%?
- IBM Proves Old Tech Can Win At New AI
- Buy or Sell International Business Machines Stock?
- International Business Machines Stock Pays Out $76 Bil – Investors Take Note
That said, if you seek upside with lower volatility than individual stocks, the Trefis High Quality portfolio presents an alternative — having outperformed the S&P 500 and generated returns exceeding 91% since its inception. Also, see – RGTI Stock: Path To 10x Growth
See earnings reaction history of all stocks

Image by Pixel_perfect from Pixabay
IBM’s Historical Odds Of Positive Post-Earnings Return
Some observations on one-day (1D) post-earnings returns:
- There are 19 earnings data points recorded over the last five years, with 12 positive and 7 negative one-day (1D) returns observed. In summary, positive 1D returns were seen about 63% of the time.
- Notably, this percentage increases to 64% if we consider data for the last 3 years instead of 5.
- Median of the 12 positive returns = 4.8%, and median of the 7 negative returns = -6.6%
Additional data for observed 5-Day (5D), and 21-Day (21D) returns post earnings are summarized along with the statistics in the table below.
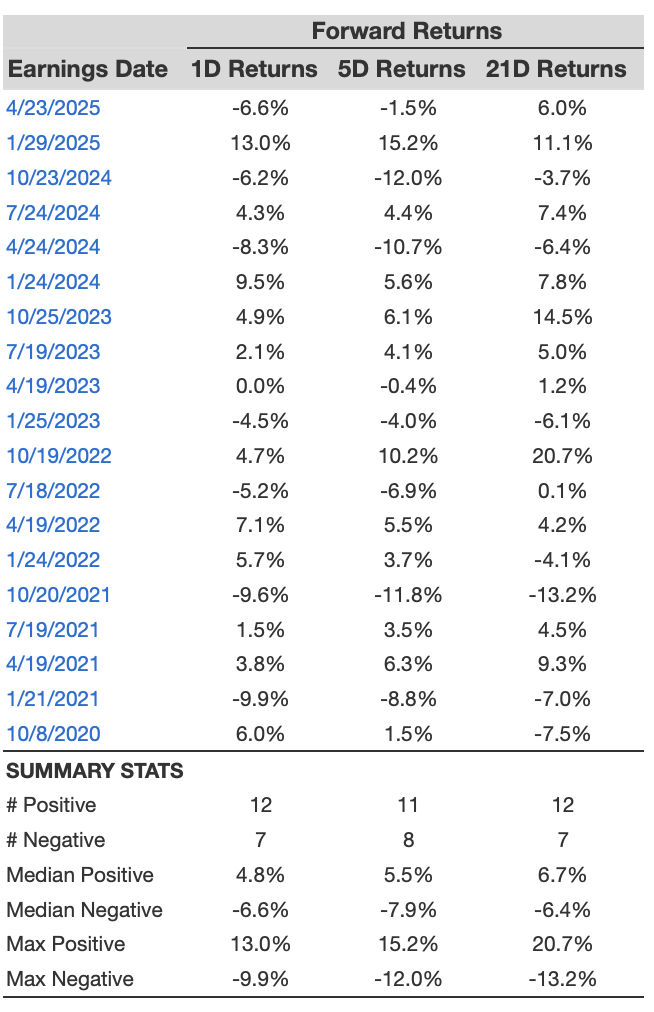
IBM 1D, 5D, and 21D Post Earnings Return
Correlation Between 1D, 5D, and 21D Historical Returns
A relatively less risky strategy (though not useful if the correlation is low) is to understand the correlation between short-term and medium-term returns post earnings, find a pair that has the highest correlation, and execute the appropriate trade. For example, if 1D and 5D show the highest correlation, a trader can position themselves “long” for the next 5 days if 1D post-earnings return is positive. Here is some correlation data based on 5-year and 3-year (more recent) history. Note that the correlation 1D_5D refers to the correlation between 1D post-earnings returns and subsequent 5D returns.
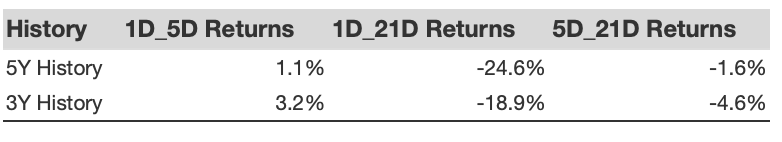
IBM Correlation Between 1D, 5D and 21D Historical Returns
Learn more about Trefis RV strategy that has outperformed its all-cap stocks benchmark (combination of all 3, the S&P 500, S&P mid-cap, and Russell 2000), to produce strong returns for investors. Separately, if you want upside with a smoother ride than an individual stock like International Business Machines, consider the High Quality portfolio, which has outperformed the S&P, and clocked >91% returns since inception.
Invest with Trefis Market-Beating Portfolios
See all Trefis Price Estimates