How Will Goldman Sachs Stock React To Its Upcoming Earnings?

Goldman Sachs (NYSE:GS) will report its Q2 2025 earnings on Wednesday, July 16, 2025. Consensus estimates project that revenue will grow by about 6% to $13.5 billion, while earnings are projected at around $9.68 per share, up 11% compared to last year. Although the broader economic outlook remains uncertain, amid ongoing concerns over tariffs on key trading partners, which could stoke inflation and dampen growth, Goldman is expected to benefit from a solid performance at its trading division. Goldman’s asset and wealth management business could also fare well as the markets remained strong over Q2. The bank oversaw a record $3.17 trillion in assets in Q1, and that number is likely to have risen further in Q2, helped by a roughly 10% gain in the S&P 500 index over the quarter. That said, the bank’s investment banking revenues are likely to remain under pressure, as geopolitical tensions and tariff-related uncertainty continue to weigh on mergers and acquisitions and IPO activity.
The company has $223 billion in current market capitalization. Revenue over the last twelve months was $54 billion and net income stood at $15 billion. That said, if you seek upside with lower volatility than individual stocks, the Trefis High Quality portfolio presents an alternative – having outperformed the S&P 500 and generated returns exceeding 91% since its inception.
See earnings reaction history of all stocks
Goldman Sachs’s Historical Odds Of Positive Post-Earnings Return
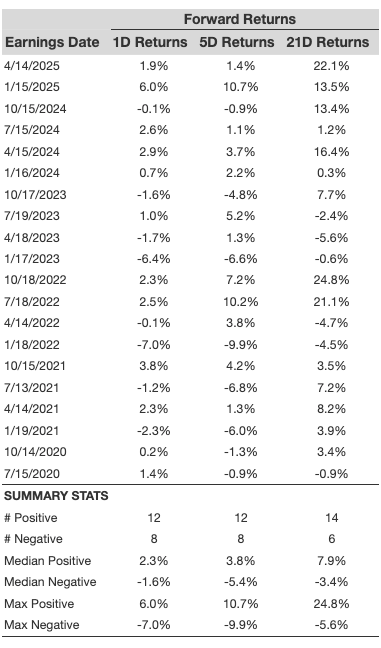
Some observations on one-day (1D) post-earnings returns:
- There are 20 earnings data points recorded over the last five years, with 12 positive and 8 negative one-day (1D) returns observed. In summary, positive 1D returns were seen about 60% of the time.
- Notably, this percentage increases to 67% if we consider data for the last 3 years instead of 5.
- Median of the 12 positive returns = 2.3%, and median of the 8 negative returns = -1.6%
Additional data for observed 5-Day (5D), and 21-Day (21D) returns post earnings are summarized along with the statistics in the table below.
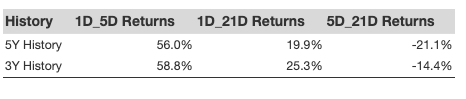
Correlation Between 1D, 5D, and 21D Historical Returns
A relatively less risky strategy (though not useful if the correlation is low) is to understand the correlation between short-term and medium-term returns post earnings, find a pair that has the highest correlation, and execute the appropriate trade. For example, if 1D and 5D show the highest correlation, a trader can position themselves “long” for the next 5 days if 1D post-earnings return is positive. Here is some correlation data based on 5-year and 3-year (more recent) history. Note that the correlation 1D_5D refers to the correlation between 1D post-earnings returns and subsequent 5D returns.
Learn more about Trefis RV strategy that has outperformed its all-cap stocks benchmark (combination of all 3, the S&P 500, S&P mid-cap, and Russell 2000), to produce strong returns for investors. Separately, if you want upside with a smoother ride than an individual stock like Goldman Sachs, consider the High Quality portfolio, which has outperformed the S&P, and clocked >91% returns since inception.
Invest with Trefis Market-Beating Portfolios
See all Trefis Price Estimates