How Will Floor & Decor Stock React To Its Upcoming Earnings?

Floor & Decor Holdings’ stock (NYSE: FND), a specialty retailer of hard surface flooring, is scheduled to release its fiscal second-quarter earnings on Thursday, July 31, 2025, with analysts projecting earnings of 56 cents per share on $1.2 billion in revenue. This would represent a 6% year-over-year increase in earnings and a 7% rise in sales compared to the prior year’s figures of 53 cents per share and $1.13 billion in revenue. Historically, FND stock has shown a tendency to outperform following earnings announcements, having increased 60% of the time with a median one-day rise of 2.3% and a maximum observed increase of 14%.
With just 250 locations averaging 50,000 to 80,000 square feet, Floor & Decor has built a $4.5 billion business. These massive, high-volume stores generate strong operating leverage—fueling $301 million in operating profit and $205 million in net income over the past year. The company sees a long-term ceiling of around 500 stores, suggesting it’s playing a high-efficiency, high-impact game. At an $8.6 billion market cap, investors are already betting on the model’s profitability scaling as store count rises.
For event-driven traders, historical patterns may offer an edge, whether by positioning ahead of earnings or reacting to post-release moves. That said, if you seek upside with lower volatility than from individual stocks, the Trefis High Quality portfolio presents an alternative, having outperformed the S&P 500 and generated returns exceeding 91% since its inception. See earnings reaction history of all stocks.

- GameStop Survived The Trap Screen. The Growth Didn’t
- Marvell Stock’s AI Bet Is Even Bigger Than You Think
- Why Did Micron Technology Stock Fall 8%?
- The Debates That Matter For AAPL Stock
- Is Ford Stock A New Engine For Your Portfolio?
- Bank Of America’s Earnings Were Great, But Its New Guidance Is The Real Story
Historical Odds Of Positive Post-Earnings Return
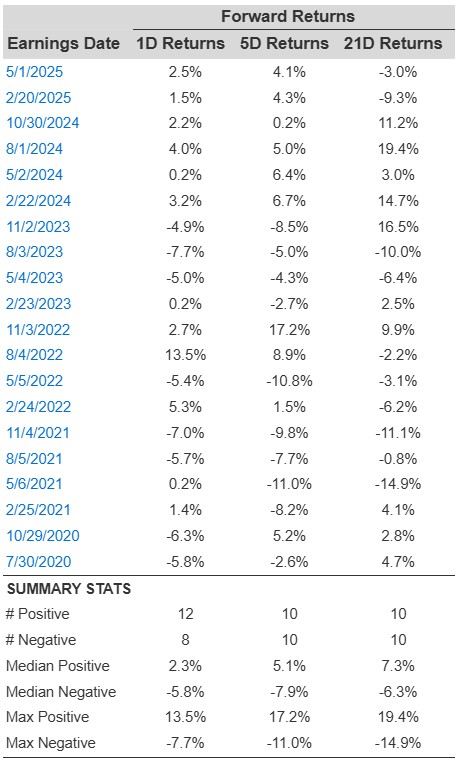
Some observations on one-day (1D) post-earnings returns:
- There are 20 earnings data points recorded over the last five years, with 12 positive and 8 negative one-day (1D) returns observed. In summary, positive 1D returns were seen about 60% of the time.
- Notably, this percentage increases to 75% if we consider data for the last 3 years instead of 5.
- Median of the 12 positive returns = 2.3%, and median of the 8 negative returns = -5.8%
Additional data for observed 5-Day (5D), and 21-Day (21D) returns post earnings are summarized along with the statistics in the table below.
Correlation Between 1D, 5D, and 21D Historical Returns
A relatively less risky strategy (though not useful if the correlation is low) is to understand the correlation between short-term and medium-term returns post earnings, find a pair that has the highest correlation, and execute the appropriate trade. For example, if 1D and 5D show the highest correlation, a trader can position themselves “long” for the next 5 days if 1D post-earnings return is positive. Here is some correlation data based on 5-year and 3-year (more recent) history. Note that the correlation 1D_5D refers to the correlation between 1D post-earnings returns and subsequent 5D returns.
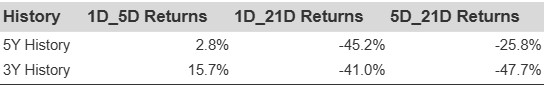
FND Correlation Between 1D, 5D and 21D Historical Returns
Learn more about Trefis RV strategy that has outperformed its all-cap stocks benchmark (combination of all 3, the S&P 500, S&P mid-cap, and Russell 2000), to produce strong returns for investors.
Invest with Trefis Market-Beating Portfolios