
How Much Will Store Sales Contribute To Foot Locker’s Top Line Growth By The End Of The Decade?
Foot Locker’s (NYSE:FL) stock has fluctuated between $40 and $59 this year after seeing a 30% st0ck plunge through 2017. One of the key reasons for Foot Locker’s stock falling from $65-70 to around $45 through last year was Nike’s (NYSE:NKE) decision to start selling shoes directly on Amazon (NASDAQ:AMZN). Since then, Foot Locker has worked on its direct-to-customer channel to help drive revenues. In addition, the company has witnessed strong demand for its Champs Sports, Foot Locker in the U.S., and Kids Foot Locker segments this year. On the other hand, Foot Locker international, Runners Point, and Sidestep brands continue to post mixed results.
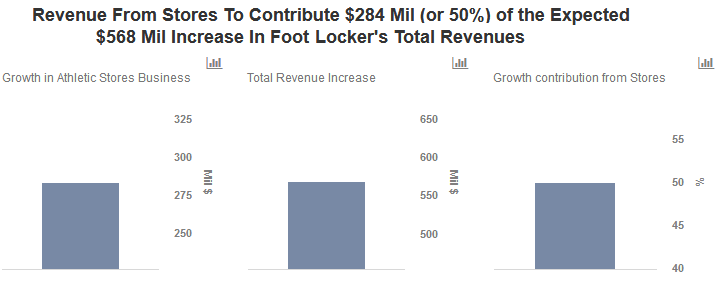
Going forward, we expect a modest 2-3% annual growth in revenues through the end of the decade, from $7.8 billion in 2017 (FY ended January 2018) to $8.3 billion by 2020. We expect total store revenues to increase from $6.7 billion in 2017 to $7 billion in the same period, providing 50% of the company’s total revenue growth. On the other hand, we forecast direct-to-consumer revenues to increase annually at high single digits in the same period with revenues increasing from $1.1 billion in 2017 to almost $1.4 billion by the end of the decade. We have created an interactive revenue contributor dashboard for Foot Locker’s athletic stores segment, where we have summarized our revenue expectations for the company. If you think differently, you can modify individual growth drivers such as total stores and revenue per square foot, to gauge how a change in these metrics will impact expected revenues in the forecast period.
Factors Driving Growth
The number of Foot Locker stores has decreased consistently over the last few years from 3,423 in 2014 to 3,310 in 2017. This is mainly attributable to the increase in online spend on apparel in recent years. As a result, Foot Locker has shut down stores primarily in the U.S. and Canada in addition to Lady Foot Locker Stores. Through 2017, the company opened 5 stores in the U.S. and Canada while they shut 51 stores to end the year at 1,021 stores in the U.S. and Canada combined. Similarly, Lady Foot Locker stores went down from 124 in 2016 to 85 in 2017.
On the other hand, the company has successfully opened Kids Foot Locker stores as well as flagship stores in Europe and Asia-Pacific. Going forward, we expect the trend to continue in the coming years with North America, Lady Foot Locker, Champs Sports and Runners Point banner stores helping drive total store count lower, which is expected to be partially offset by increasing presence in Europe, Asia-Pacific and the Kids segment. We forecast total store count to fall to around 3,250 by the end of the decade.
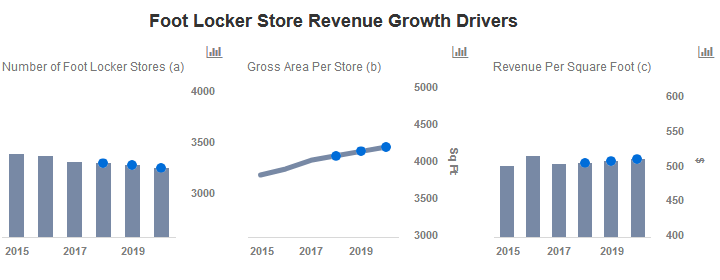 Foot Locker has reported a positive trend in two other key metrics – gross area per store and implied revenue per store – in recent years. Despite shutting down stores, the total gross square footage has been an increasing metric, which means that the company is choosing to open larger stores generating higher revenue per store in place of smaller stores that generated lower revenues. As seen in the chart above, the gross area per store has increased from 3,800 sq ft in 2015 to over 4,000 sq ft by 2017. We expect this trend to continue with an expected average gross area of 4,200 sq ft per store by 2020.
As a result of an increasing trend of bigger stores coupled with the loss of revenues due to the Nike-Amazon deal, revenue per square foot took a hit in 2017, with the metric falling from $514 per square foot in 2016 to $503 per square foot in 2017. We expect this figure to gradually recover to over $510 by the end of the decade. Based on these estimates, we expect revenue from stores to increase at a modest pace of 1.5% per year over the next three years, with revenues increasing from $6.7 billion in 2017 to $7 billion by 2020.
What’s behind Trefis? See How it’s Powering New Collaboration and What-Ifs
For CFOs and Finance Teams | Product, R&D, and Marketing Teams
Like our charts? Explore example interactive dashboards and create your own