How Will Freeport-McMoRan Stock React To Its Upcoming Earnings?

Freeport-McMoRan (NYSE:FCX) is set to report its earnings on Tuesday, October 28, 2025. We expect Freeport-McMoRan Inc. to post quarterly revenues of around $8.3 billion, supported by higher realized copper and gold prices alongside steady production volumes from its key mining operations in North and South America, as well as Indonesia. However, margins may face mild pressure from rising energy, labor, and input costs, along with ongoing inflation in mining consumables and maintenance expenses.
While stronger copper and gold prices should bolster operating cash flow, elevated sustaining capital requirements and continued investment in growth projects could temper near-term profitability. Continued emphasis on cost discipline and productivity improvements will be crucial to offset inflationary headwinds. Over the medium term, expansion projects at Grasberg and new leach initiatives in the Americas, combined with firm copper demand from the energy transition, provide a constructive backdrop for earnings momentum and cash generation in the upcoming quarters.
The company has $59 Bil in current market capitalization. Revenue over the last twelve months was $26 Bil, and it was operationally profitable with $6.9 Bil in operating profits and net income of $1.9 Bil. While a lot will depend on how results stack up against consensus and expectations, understanding historical patterns might just turn the odds in your favor if you are an event-driven trader.

There are two ways to do that: understand the historical odds and position yourself prior to the earnings release, or look at the correlation between immediate and medium-term returns post earnings and position yourself accordingly after the earnings are released. That said, if you seek upside with lower volatility than individual stocks, the Trefis High Quality portfolio presents an alternative – having outperformed the S&P 500 and generated returns exceeding 105% since its inception.
See earnings reaction history of all stocks
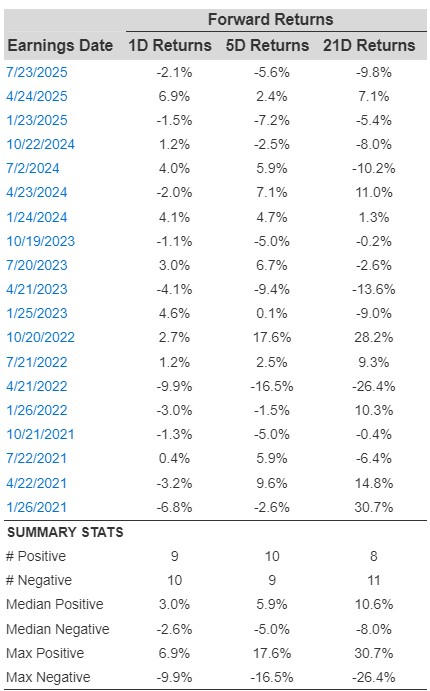
Freeport-McMoRan’s Historical Odds Of Positive Post-Earnings Return
Some observations on one-day (1D) post-earnings returns:
- There are 19 earnings data points recorded over the last five years, with 9 positive and 10 negative one-day (1D) returns observed. In summary, positive 1D returns were seen about 47% of the time.
- Notably, this percentage increases to 55% if we consider data for the last 3 years instead of 5.
- Median of the 9 positive returns = 3.0%, and median of the 10 negative returns = -2.6%
Additional data for observed 5-Day (5D) and 21-Day (21D) returns post earnings are summarized along with the statistics in the table below.
1D, 5D, and 21D Post Earnings Return
Correlation Between 1D, 5D, and 21D Historical Returns
A relatively less risky strategy (though not useful if the correlation is low) is to understand the correlation between short-term and medium-term returns post earnings, find a pair that has the highest correlation, and execute the appropriate trade. For example, if 1D and 5D show the highest correlation, a trader can position themselves “long” for the next 5 days if the 1D post-earnings return is positive. Here is some correlation data based on a 5-year and a 3-year (more recent) history. Note that the correlation 1D_5D refers to the correlation between 1D post-earnings returns and subsequent 5D returns.
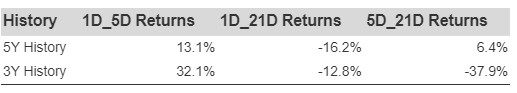
Correlation Between 1D, 5D and 21D Historical Returns
Learn more about Trefis RV strategy that has outperformed its all-cap stocks benchmark (combination of all 3, the S&P 500, S&P mid-cap, and Russell 2000), to produce strong returns for investors. Separately, if you want upside with a smoother ride than an individual stock like Freeport-McMoRan, consider the High Quality portfolio, which has outperformed the S&P and clocked >105% returns since inception.
Invest with Trefis Market-Beating Portfolios
See all Trefis Price Estimates