How Will Eaton Stock React To Its Upcoming Earnings?

Eaton Corp (NYSE: ETN) is a diversified industrial firm specializing in intelligent power management, helping customers use electrical, mechanical, and hydraulic power more efficiently and sustainably. It is set to report its second-quarter earnings on Tuesday, August 5, 2025, with analysts projecting adjusted earnings of $2.92 per share on $6.91 billion in revenue. This would represent a 7% year-over-year increase in earnings and a 9% growth in sales compared to the prior year’s figures of $2.73 per share and $6.35 billion in revenue. Historically, ETN stock has shown a tendency to outperform following earnings announcements, having increased 58% of the time with a median one-day rise of 3.6% and a maximum observed increase of 8%.
Eaton reported strong Q1 2025 results, with revenue up 7.3% to $6.38 billion and 9% organic growth, led by strength in Electrical and Aerospace segments. Adjusted EPS rose 13% to a record $2.72, and segment margins hit 23.9%. The company raised full-year guidance, expecting 7.5–9.5% organic growth and adjusted EPS of $11.80–12.20. The company has $151 Bil in current market capitalization. Revenue over the last twelve months was $25 Bil, and it was operationally profitable with $4.8 Bil in operating profits and net income of $3.9 Bil. While a lot will depend on how results stack up against consensus and expectations, understanding historical patterns might just turn the odds in your favor if you are an event-driven trader.
For event-driven traders, historical patterns may offer an edge, whether by positioning ahead of earnings or reacting to post-release moves. That said, if you seek upside with lower volatility than from individual stocks, the Trefis High Quality portfolio presents an alternative, having outperformed the S&P 500 and generated returns exceeding 91% since its inception.
See earnings reaction history of all stocks.
- The Iran War Trade Investors Are Missing
- Broken Windows: How Microsoft Loses Its AI Premium
- GE Aerospace: Blue-Chip Performance, Red-Line Valuation
- Why Betting Against Amazon Stock In 2022 Was A Mistake
- How To Earn 12% Yield While Waiting to Buy RCL 30% Cheaper
- Where Could The Next Breakout for Applied Materials Stock Come From

Historical Odds Of Positive Post-Earnings Return
Some observations on one-day (1D) post-earnings returns:
- There are 19 earnings data points recorded over the last five years, with 11 positive and 8 negative one-day (1D) returns observed. In summary, positive 1D returns were seen about 58% of the time.
- However, this percentage decreases to 50% if we consider data for the last 3 years instead of 5.
- Median of the 11 positive returns = 3.6%, and median of the 8 negative returns = -1.6%
Additional data for observed 5-Day (5D) and 21-Day (21D) returns post earnings are summarized along with the statistics in the table below.

ETN Forward 1D Returns, 5D returns, 21D Returns
Correlation Between 1D, 5D, and 21D Historical Returns
A relatively less risky strategy (though not useful if the correlation is low) is to understand the correlation between short-term and medium-term returns post earnings, find a pair that has the highest correlation, and execute the appropriate trade. For example, if 1D and 5D show the highest correlation, a trader can position themselves “long” for the next 5 days if the 1D post-earnings return is positive. Here is some correlation data based on a 5-year and a 3-year (more recent) history. Note that the correlation 1D_5D refers to the correlation between 1D post-earnings returns and subsequent 5D returns.
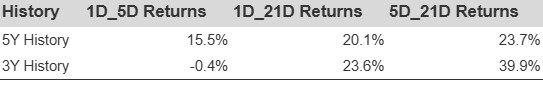
ETN Correlation Between 1D, 5D and 21D Historical Returns
Learn more about Trefis RV strategy that has outperformed its all-cap stocks benchmark (combination of all 3, the S&P 500, S&P mid-cap, and Russell 2000), to produce strong returns for investors.
Invest with Trefis Market-Beating Portfolios