Why Betting Against Amazon Stock In 2022 Was A Mistake

In just over three years, Amazon (NASDAQ: AMZN) transformed from a “battered retailer” into a “high-margin AI powerhouse.” While revenue growth provided the floor, multiple expansion provided the ceiling.
We deconstruct the 158% gain into two core mechanics:
- Revenue Per Share (RPS) Growth: Increased by 33% ($50 to $67)
- Price-to-Sales (P/S) Expansion: Increased by 88% (1.7x to 3.2x)
Our “Why Amazon Stock Moved” dashboard provides more details.
Revenue Fundamentals: The Three-Engine Growth Phase
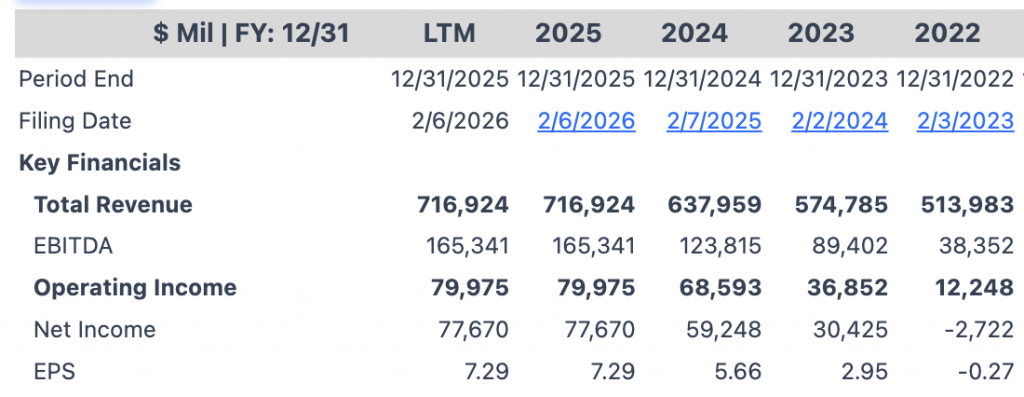
Amazon’s revenue didn’t just recover; it scaled from $514B (2022) to $717B (2025). With a stable share count of 10.6B, RPS grew in lockstep with net sales.
- AWS Re-acceleration: After a 2023 “optimization” lull, Generative AI demand pushed AWS growth back toward 19% by 2024.
- Ad Tech Dominance: Amazon’s advertising arm compounded at 20%+, leveraging high-intent purchase data that competitors lack.
- Logistics as a Service: Third-party seller services matured into a high-moat infrastructure play for global e-commerce.

Image by Finn from Pixabay
The Multiplier Effect: Why the P/S Ratio Exploded
The true story of the 158% gain is the market’s willingness to pay more for every dollar Amazon earns. In 2022, the P/S ratio hit a decade-low of 1.7x due to a “perfect storm”: record-fast rate hikes, a post-pandemic retail hangover, and a $12B Rivian-related net loss.
The Narrative Shift (2023–2026):
The P/S ratio rebounded to a peak of 3.8x before settling at the current 3.2x. This re-rating was driven by:
- The AI Premium: AWS transitioned from a storage provider to an AI platform layer (chips, LLMs, and Bedrock), attracting a higher valuation multiple.
- Margin Transformation: As high-margin Ads and AWS grew faster than low-margin Retail, the “blended” value of every dollar of revenue increased.
- Operational Efficiency: Amazon slashed 57,000+ roles and optimized its fulfillment network, proving it could grow profits faster than sales.
EPS: The Confirmation Signal
While revenue multiples move with sentiment and expectations, Earnings Per Share (EPS) reflects reality. Amazon’s swing from a $0.27 loss in 2022 to a $7.17 profit in 2025 represents a massive structural pivot.
Key Insight: The P/S multiple expanded ahead of the earnings. Now that $7+ EPS is the baseline, the stock price is supported by fundamental cash flow rather than just speculative “hope.”
Outlook: Risks And Re-rating Triggers
Can the 3.2x Multiple Hold?
To maintain this valuation, Amazon must defend its turf:
- AWS vs. Peers: Microsoft and Google are aggressive in AI; any loss in cloud market share will deflate the multiple.
- Retail Headwinds: Low-cost entrants (Temu/Shein) and persistent logistics inflation threaten the retail floor.
The Path to $250+:
To reach $250, Amazon must pivot from “spending” to “yielding.” While the $200B Capex guide for 2026 initially rattled FCF expectations, it is the essential fuel for AWS’s 24% re-acceleration. The stock’s upside is now decoupled from retail and tied strictly to AI infrastructure efficiency: specifically, proving that proprietary Trainium3 silicon can outperform third-party GPUs to expand margins. While Project Kuiper and Pharmacy act as long-term “margin insurance” to prevent Amazon from being valued as a mature utility, the immediate path to $250 depends on the market’s conviction that this massive capital cycle is an offensive play for AI dominance, not merely defensive survival.
Smart Investing Begins With Portfolios
While Amazon’s 158% gain illustrates the power of a successful fundamental turnaround, individual stocks soar and sink—the key to long-term wealth is staying invested. A balanced portfolio helps you ride the kind of market volatility seen during Amazon’s 2022 “hangover,” boosting overall gains, while reducing the risk of being over-leveraged to a single company’s Capex cycle.
The Trefis High Quality (HQ) Portfolio is designed for this exact balance. Consisting of 30 rigorously selected stocks, it has a proven track record of comfortably outperforming a benchmark that includes the S&P 500, S&P mid-cap, and Russell 2000 indices. By focusing on companies with similar fundamental strength to Amazon but diversified across sectors, the HQ Portfolio has posted more than 105% in cumulative return since inception. It achieves this with lower relative risk than the benchmark, providing a smoother trajectory for your capital even when individual tech giants face “Capex shocks.”
Invest with Trefis Market-Beating Portfolios
See all Trefis Price Estimates