How Will Darden Restaurants’ Stock React To Its Upcoming Earnings?

Darden Restaurants (NYSE: DRI), the casual dining giant behind Olive Garden and LongHorn, will report fiscal Q1 2025 results (May year-end) on Thursday, September 18. Street estimates call for earnings of $2.01 per share on $3.04 billion in revenue, implying 15% EPS growth and 10% sales growth from last year’s $1.75 per share on $2.76 billion. Historically, DRI stock has risen after earnings more often than not—up 55% of the time—with a median one-day gain of 5.8% and a peak move of 15%.
Recent performance has been steady but mixed. In Q4 FY2024, sales climbed 7% to $2.96 billion, though same-store sales were flat as Olive Garden softened and LongHorn stayed resilient. Cost discipline and easing food inflation boosted EPS to $2.65, while a dividend hike and $97 million in buybacks reinforced shareholder focus. For FY2025, management struck a cautious tone, guiding to 1–2% comp growth, $11.8–$11.9 billion in sales, and EPS of $9.40–$9.60, leaning on new restaurant openings and the Ruth’s Chris integration to offset sluggish comps. Separately check, What’s Next For Arista Networks Stock After 9% Plunge?
At a $25 billion market cap, Darden has generated $12 billion in trailing twelve-month revenue, $1.4 billion in operating profit, and $1.0 billion in net income. For event-driven traders, the key is whether Q1 results beat consensus—and how the stock reacts relative to historical patterns. Investors can position ahead of the release based on past odds, or wait to capture post-earnings trends in the days that follow. For those seeking a steadier alternative, the Trefis High Quality portfolio —up 91% since inception—has consistently outperformed the S&P 500. See earnings reaction history of all stocks.

Darden Restaurants’ Historical Odds Of Positive Post-Earnings Return
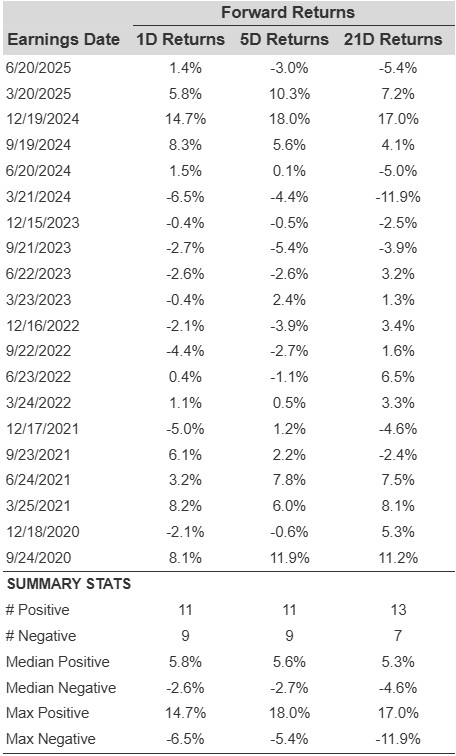
Some observations on one-day (1D) post-earnings returns:
- There are 20 earnings data points recorded over the last five years, with 11 positive and 9 negative one-day (1D) returns observed. In summary, positive 1D returns were seen about 55% of the time.
- However, this percentage decreases to 42% if we consider data for the last 3 years instead of 5.
- Median of the 11 positive returns = 5.8%, and median of the 9 negative returns = -2.6%
Additional data for observed 5-Day (5D) and 21-Day (21D) returns post earnings are summarized along with the statistics in the table below.
DRI Correlation Between 1D, 5D, and 21D Forward Returns
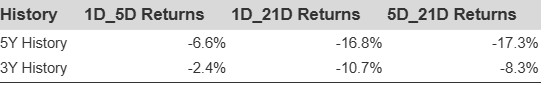
Correlation Between 1D, 5D, and 21D Historical Returns
A relatively less risky strategy (though not useful if the correlation is low) is to understand the correlation between short-term and medium-term returns post earnings, find a pair that has the highest correlation, and execute the appropriate trade. For example, if 1D and 5D show the highest correlation, a trader can position themselves “long” for the next 5 days if 1D post-earnings return is positive. Here is some correlation data based on 5-year and 3-year (more recent) history. Note that the correlation 1D_5D refers to the correlation between 1D post-earnings returns and subsequent 5D returns.
DRI Correlation Between 1D, 5D, and 21D Historical Returns
DRI Correlation Between 1D, 5D and 21D Historical Returns
Learn more about Trefis RV strategy that has outperformed its all-cap stocks benchmark (combination of all 3, the S&P 500, S&P mid-cap, and Russell 2000), to produce strong returns for investors.
Invest with Trefis Market-Beating Portfolios