How Will Dollar General’s Stock React To Its Upcoming Earnings?

Dollar General (NYSE:DG) is scheduled to release its fiscal first-quarter earnings on Tuesday, June 3, 2025, with analysts projecting earnings of $1.49 per share on $10.29 billion in revenue. This would represent a 10% year-over-year decline in earnings and a 4% growth in sales compared to the prior year’s figures of $1.65 per share and $9.91 billion in revenue. Historically, DG stock has declined 74% of the time following earnings announcements, with a median one-day drop of 4.2% and a maximum observed decline of 32%.
Dollar General’s focus on domestically produced essential goods, such as food, health, and household items, means that only about 4% of its inventory is imported, limiting its exposure to tariff-related cost increases. However, the company’s growth has been uneven in recent years. The retailer’s profitability has deteriorated sharply: fourth-quarter earnings per share fell 53% year over year, contributing to a 32% decline for the full year in 2024. A key factor behind the company’s recent struggles has been its excess inventory. For the current fiscal year ending in January, it expects net sales to grow between 3.4% and 4.4%, but same-store sales—reflecting performance at locations open for at least one year—are projected to rise only 1.2% to 2.2%. The company has $21 Bil in current market capitalization. Revenue over the last twelve months was $41 Bil, and it was operationally profitable with $1.7 Bil in operating profits and net income of $1.1 Bil. Buy or Sell Dollar General Stock?
For event-driven traders, historical patterns may offer an edge, whether by positioning ahead of earnings or reacting to post-release moves. That said, if you seek upside with lower volatility than from individual stocks, the Trefis High Quality portfolio presents an alternative, having outperformed the S&P 500 and generated returns exceeding 91% since its inception. See earnings reaction history of all stocks.

- After Its Sharp Drop, Is Broadcom Stock An Opportunity Or A Trap?
- How One Project Funnel Reframes The Sunbelt Rentals Stock Story
- What Future Earnings Are QQQM’s Companies Forecasting?
- XBI Ignored The Market’s Downturn
- Your VB Position Is At A Record High. Don’t Overthink It.
- Uber Stock And The Growth Rate That Matters Most
Dollar General’s Historical Odds Of Positive Post-Earnings Return
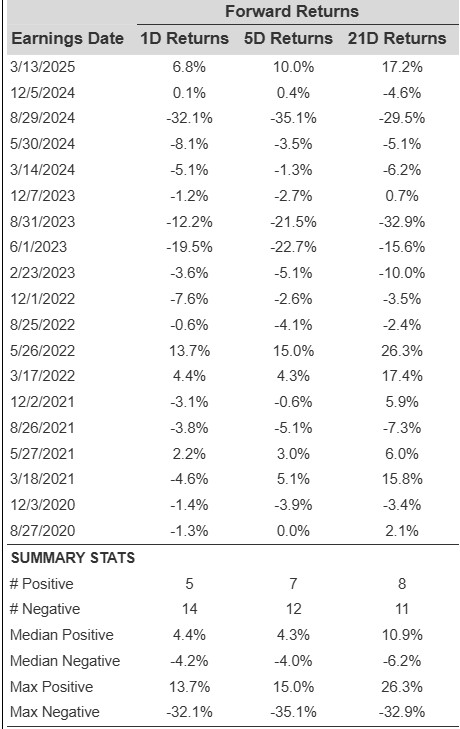
Some observations on one-day (1D) post-earnings returns:
- There are 19 earnings data points recorded over the last five years, with 5 positive and 14 negative one-day (1D) returns observed. In summary, positive 1D returns were seen about 26% of the time.
- However, this percentage decreases to 18% if we consider data for the last 3 years instead of 5.
- Median of the 5 positive returns = 4.4%, and median of the 14 negative returns = -4.2%
Additional data for observed 5-Day (5D), and 21-Day (21D) returns post earnings are summarized along with the statistics in the table below.
Correlation Between 1D, 5D, and 21D Historical Returns
A relatively less risky strategy (though not useful if the correlation is low) is to understand the correlation between short-term and medium-term returns post earnings, find a pair that has the highest correlation, and execute the appropriate trade. For example, if 1D and 5D show the highest correlation, a trader can position themselves “long” for the next 5 days if 1D post-earnings return is positive. Here is some correlation data based on 5-year and 3-year (more recent) history. Note that the correlation 1D_5D refers to the correlation between 1D post-earnings returns and subsequent 5D returns.
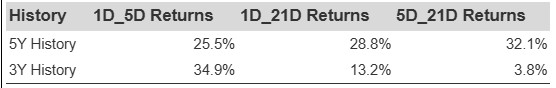
DG Correlation Between 1D, 5D and 21D Historical Returns
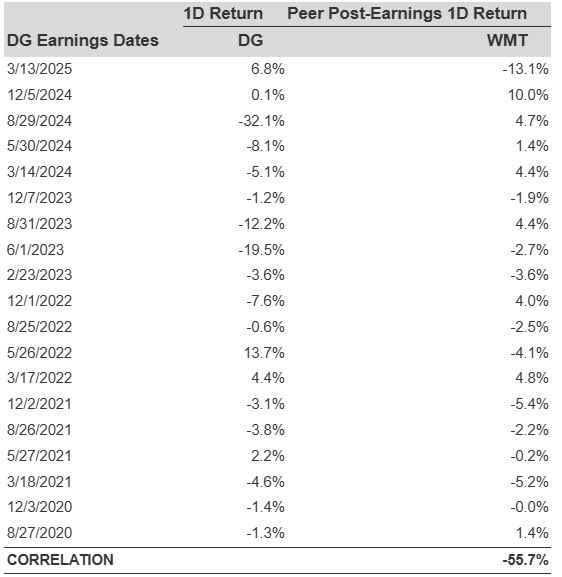
Is There Any Correlation With Peer Earnings?
Sometimes, peer performance can have influence on post-earnings stock reaction. In fact, the pricing-in might begin before the earnings are announced. Here is some historical data on the past post-earnings performance of Dollar General stock compared with the stock performance of peers that reported earnings just before Dollar General. For fair comparison, peer stock returns also represent post-earnings one-day (1D) returns.
Learn more about Trefis RV strategy that has outperformed its all-cap stocks benchmark (combination of all 3, the S&P 500, S&P mid-cap, and Russell 2000), to produce strong returns for investors.
Invest with Trefis Market-Beating Portfolios