How To Trade CSX Stock Ahead of Its Upcoming Earnings?

CSX (NASDAQ:CSX) is scheduled to announce its earnings on Wednesday, July 23, 2025. Historically, CSX has shown a positive one-day return in 65% of instances following its earnings announcements over the past five years. The median positive return on these days was 2.6%, with a maximum one-day positive return of 4.3%.
For event-driven traders, understanding these historical patterns can provide a strategic advantage, though actual results against consensus estimates will be a primary driver. There are two main approaches to consider:
- Pre-Earnings Positioning: Based on historical odds, you could choose to open a position before the earnings release.
- Post-Earnings Positioning: Alternatively, you could analyze the correlation between immediate and medium-term returns after the earnings are released and then position yourself accordingly.
Current consensus estimates for CSX’s upcoming earnings report are $0.41 per share on sales of $3.57 billion. This compares to earnings of $0.49 per share on sales of $3.7 billion in the same quarter last year.
From a fundamental perspective, CSX currently has a market capitalization of $65 billion. Over the last twelve months, the company reported revenues of $14 billion, with $5.1 billion in operating profits and a net income of $3.2 billion.
That said, if you seek upside with lower volatility than individual stocks, the Trefis High Quality portfolio presents an alternative — having outperformed the S&P 500 and generated returns exceeding 91% since its inception.
See earnings reaction history of all stocks

Image by NGUYEN NGOC TIEN from Pixabay
CSX’s Historical Odds Of Positive Post-Earnings Return
Some observations on one-day (1D) post-earnings returns:
- There are 20 earnings data points recorded over the last five years, with 13 positive and 7 negative one-day (1D) returns observed. In summary, positive 1D returns were seen about 65% of the time.
- However, this percentage decreases to 64% if we consider data for the last 3 years instead of 5.
- Median of the 13 positive returns = 2.6%, and median of the 7 negative returns = -3.2%
Additional data for observed 5-Day (5D), and 21-Day (21D) returns post earnings are summarized along with the statistics in the table below.
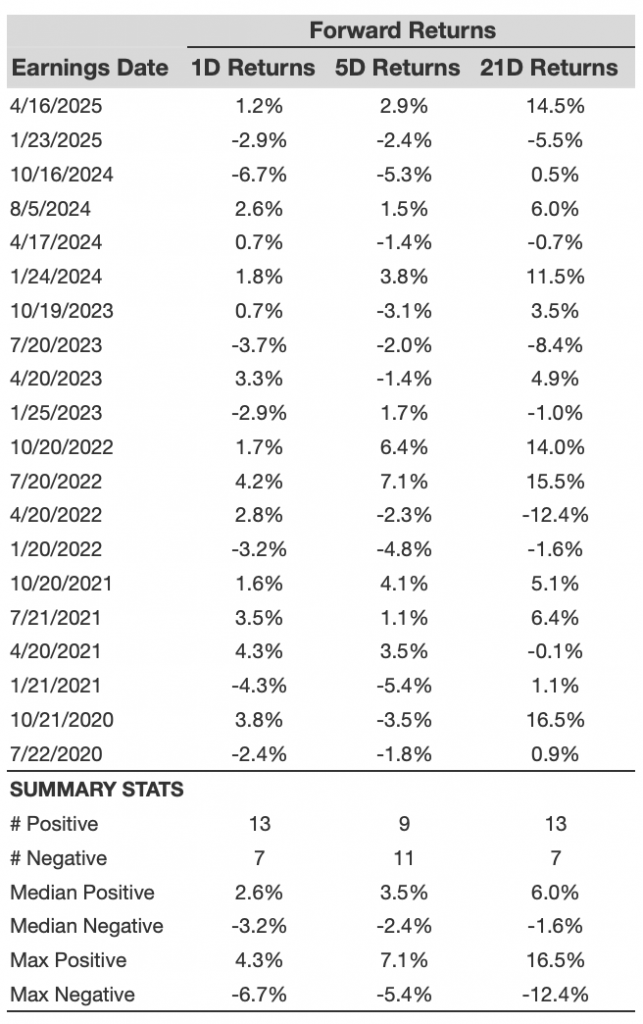
CSX 1D, 5D, and 21D Post-Earnings Return
Correlation Between 1D, 5D, and 21D Historical Returns
A relatively less risky strategy (though not useful if the correlation is low) is to understand the correlation between short-term and medium-term returns post earnings, find a pair that has the highest correlation, and execute the appropriate trade. For example, if 1D and 5D show the highest correlation, a trader can position themselves “long” for the next 5 days if 1D post-earnings return is positive. Here is some correlation data based on 5-year and 3-year (more recent) history. Note that the correlation 1D_5D refers to the correlation between 1D post-earnings returns and subsequent 5D returns.
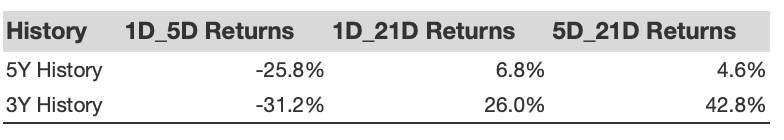
CSX Correlation Between 1D, 5D and 21D Historical Returns
Learn more about Trefis RV strategy that has outperformed its all-cap stocks benchmark (combination of all 3, the S&P 500, S&P mid-cap, and Russell 2000), to produce strong returns for investors. Separately, if you want upside with a smoother ride than an individual stock like CSX, consider the High Quality portfolio, which has outperformed the S&P, and clocked >91% returns since inception.
Invest with Trefis Market-Beating Portfolios
See all Trefis Price Estimates