How Will Copart Stock React To Its Upcoming Earnings?

Copart (NASDAQ:CPRT) , a global online auto auction platform focusing on auto salvaging, is set to publish its Q4 FY’25 earnings (July 2025 quarter) on September 3, reporting on a quarter that is likely to see sales volumes trend higher. Consensus estimates point to revenue of about $1.14 billion for the quarter, marking an increase of 6% year-over-year, while earnings are estimated to come in at $0.36 per share, $0.03 higher compared to last year. The company has seen its business grow in recent quarters, led by a higher supply of vehicles being scrapped due to natural disasters. Moreover, higher vehicle repair costs and greater complexity of the latest cars also mean that insurance companies are declaring more vehicles as totaled instead of choosing to repair them. The company is also expanding its geographic footprint in multiple countries, including Europe, Latin America, and Asia and this is also helping to drive growth.
The company has $47 Bil in current market capitalization. Revenue over the last twelve months was $4.6 Bil, and it was operationally profitable with $1.6 Bil in operating profits and net income of $1.5 Bil. While a lot will depend on how results stack up against consensus and expectations, understanding historical patterns might just turn the odds in your favor if you are an event-driven trader.
There are two ways to do that: understand the historical odds and position yourself prior to the earnings release, or look at the correlation between immediate and medium-term returns post earnings and position yourself accordingly after the earnings are released. That said, if you seek upside with lower volatility than individual stocks, the Trefis High Quality portfolio presents an alternative – having outperformed the S&P 500 and generated returns exceeding 91% since its inception.
See earnings reaction history of all stocks
- Get Paid 8.6% to Buy GOOGL at a 30% Discount – Here’s How
- What Could Spark the Next Big Move In Netflix Stock
- Why Amazon.com Stock May Drop Soon
- Cash Rich, Low Price – Gartner Stock to Break Out?
- Does Johnson & Johnson Stock Have More Upside?
- Has American Water Works Stock Quietly Become a Value Opportunity?
Copart’s Historical Odds Of Positive Post-Earnings Return
Some observations on one-day (1D) post-earnings returns:
- There are 19 earnings data points recorded over the last five years, with 8 positive and 11 negative one-day (1D) returns observed. In summary, positive 1D returns were seen about 42% of the time.
- Notably, this percentage increases to 45% if we consider data for the last 3 years instead of 5.
- Median of the 8 positive returns = 1.8%, and median of the 11 negative returns = -1.8%
Additional data for observed 5-Day (5D) and 21-Day (21D) returns post earnings are summarized along with the statistics in the table below.
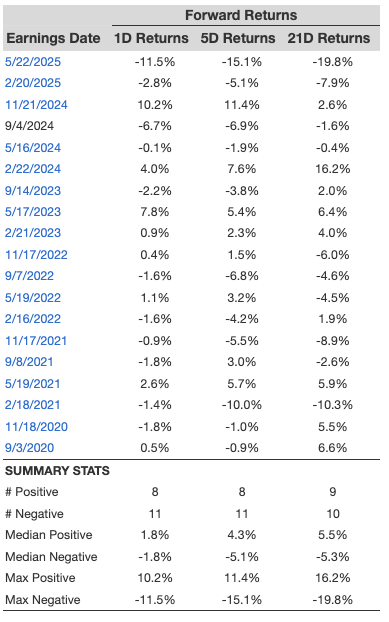
1D, 5D, and 21D Post Earnings Return
Correlation Between 1D, 5D, and 21D Historical Returns
A relatively less risky strategy (though not useful if the correlation is low) is to understand the correlation between short-term and medium-term returns post earnings, find a pair that has the highest correlation, and execute the appropriate trade. For example, if 1D and 5D show the highest correlation, a trader can position themselves “long” for the next 5 days if the 1D post-earnings return is positive. Here is some correlation data based on a 5-year and a 3-year (more recent) history. Note that the correlation 1D_5D refers to the correlation between 1D post-earnings returns and subsequent 5D returns.
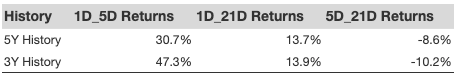
Correlation Between 1D, 5D and 21D Historical Returns
Is There Any Correlation With Peer Earnings?
Sometimes, peer performance can have an influence on post-earnings stock reaction. In fact, the pricing-in might begin before the earnings are announced. Here is some historical data on the past post-earnings performance of Copart stock compared with the stock performance of peers that reported earnings just before Copart. For fair comparison, peer stock returns also represent post-earnings one-day (1D) returns.
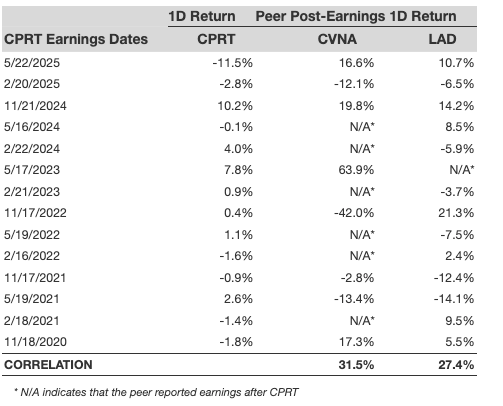
Correlation With Peer Earnings
Learn more about Trefis RV strategy that has outperformed its all-cap stocks benchmark (combination of all 3, the S&P 500, S&P mid-cap, and Russell 2000), to produce strong returns for investors. Separately, if you want upside with a smoother ride than an individual stock like Copart, consider the High Quality portfolio, which has outperformed the S&P and clocked >91% returns since inception.
Invest with Trefis Market Beating Portfolios
See all Trefis Price Estimates