How Will Costco’s Stock React To Its Upcoming Earnings?

Costco (NASDAQ: COST) will report fiscal fourth quarter 2025 results on Thursday, September 25. Street estimates call for earnings of $5.81 per share on $86.11 billion in revenue, implying 10% EPS growth and 8% sales growth from last year’s $5.29 per share on $79.70 billion. Historically, COST stock has risen after earnings 65% of the time—with a median one-day gain of 1.9% and a peak move of 7%. Also see Buy or Fear Costco Stock?
Costco topped expectations in Q3 FY2025 with EPS of $4.28 (up 13% y-o-y) on $63.2 billion in revenue (up 8%), driven by 8% comp sales growth and a 16% e-commerce surge. While tariffs pose risks, Costco’s scale, bulk discounts, and low-price strategy make it a potential beneficiary, with membership fee hikes set to meaningfully boost results starting in Q4 2025. Separately check, StubHub IPO: A Hot Ticket Or A Risky Bet?
The warehouse club operator has $418 Bil in current market capitalization. Revenue over the last twelve months was $269 Bil, and it was operationally profitable with $10 Bil in operating profits and net income of $7.8 Bil. While a lot will depend on how results stack up against consensus and expectations, understanding historical patterns might just turn the odds in your favor if you are an event-driven trader.
There are two ways to do that: understand the historical odds and position yourself prior to the earnings release, or look at the correlation between immediate and medium-term returns post earnings and position yourself accordingly after the earnings are released. For those seeking a steadier alternative, the Trefis High Quality portfolio —up 91% since inception—has consistently outperformed the S&P 500. As a group, HQ Portfolio stocks provided better returns with less risk versus the benchmark index; less of a roller-coaster ride, as evident in HQ Portfolio performance metrics. See earnings reaction history of all stocks.

Photo by Alexas_Fotos on Pixabay
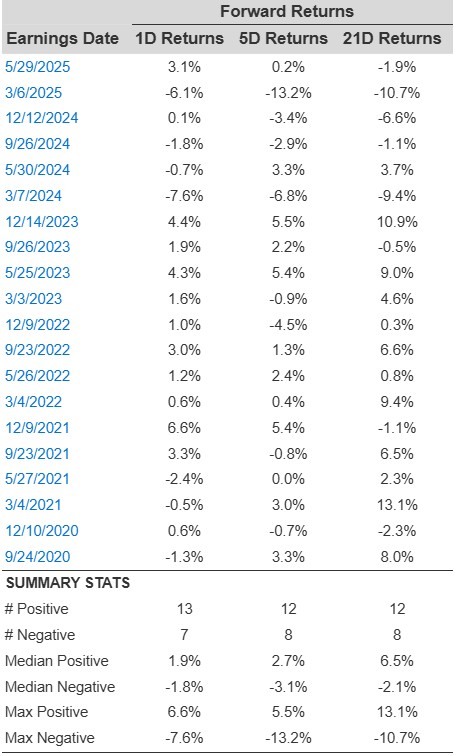
Costco’s Historical Odds Of Positive Post-Earnings Return
Some observations on one-day (1D) post-earnings returns:
- There are 20 earnings data points recorded over the last five years, with 13 positive and 7 negative one-day (1D) returns observed. In summary, positive 1D returns were seen about 65% of the time.
- However, this percentage decreases to 64% if we consider data for the last 3 years instead of 5.
- Median of the 13 positive returns = 1.9%, and median of the 7 negative returns = -1.8%
Additional data for observed 5-Day (5D) and 21-Day (21D) returns post earnings are summarized along with the statistics in the table below.
COST Correlation Between 1D, 5D and 21D Forward Returns
Correlation Between 1D, 5D, and 21D Historical Returns
A relatively less risky strategy (though not useful if the correlation is low) is to understand the correlation between short-term and medium-term returns post earnings, find a pair that has the highest correlation, and execute the appropriate trade. For example, if 1D and 5D show the highest correlation, a trader can position themselves “long” for the next 5 days if 1D post-earnings return is positive. Here is some correlation data based on 5-year and 3-year (more recent) history. Note that the correlation 1D_5D refers to the correlation between 1D post-earnings returns and subsequent 5D returns.
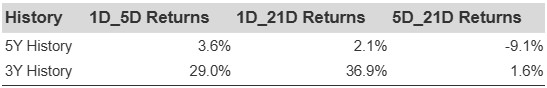
COST Correlation Between 1D, 5D and 21D Historical Returns
Is There Any Correlation With Peer Earnings?
Sometimes, peer performance can have an influence on post-earnings stock reaction. In fact, the pricing-in might begin before the earnings are announced. Here is some historical data on the past post-earnings performance of Costco Wholesale stock compared with the stock performance of peers that reported earnings just before Costco Wholesale. For fair comparison, peer stock returns also represent post-earnings one-day (1D) returns.
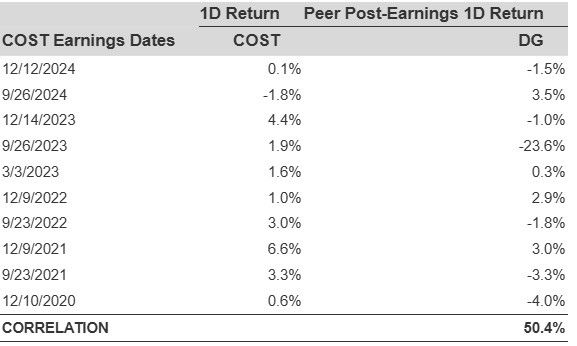
Correlation with Peers
Learn more about Trefis RV strategy that has outperformed its all-cap stocks benchmark (combination of all 3, the S&P 500, S&P mid-cap, and Russell 2000), to produce strong returns for investors.
Invest with Trefis Market-Beating Portfolios